

All three major U.S. stock indexes have climbed throughout 2026. As of Aug. 12, the S&P 500 (^GSPC +0.65%) has gained about 13%, while the Nasdaq Composite (^IXIC +0.81%) and Dow Jones Industrial Average (^DJI +0.13%) have advanced 14% and 12%, respectively.
All three indexes trade near record levels even as the macro backdrop remains unsettled by stubborn inflation, a leadership transition at the Federal Reserve, and ongoing tensions in the Middle East centered on the Iran war.
Resilient corporate earnings — particularly those tied to artificial intelligence (AI) developers and infrastructure spending — have managed to satisfy investors, pushing valuations higher despite these headwinds.

Image source: Getty Images.
This time-tested valuation metric should not be overlooked
During the mid-1990s, Yale economist Robert Shiller popularized a valuation tool known as the cyclically adjusted price-to-earnings (CAPE) ratio. The Shiller CAPE ratio measures valuation by dividing the current price of the S&P 500 by the average of the prior 10 years of inflation-adjusted earnings. The idea behind the CAPE ratio is that a single year of earnings can be distorted by temporary economic swings.
Unlike a conventional price-to-earnings multiple (P/E), the CAPE ratio smooths out economic fluctuations to assess longer-term valuation extremes. Although the concept has only gained attention over the last few decades, economists have reconstructed CAPE readings using historical prices and earnings data — extending the entire data set back to 1871.
Where is the CAPE ratio today relative to historical levels?
As of mid-2026, the CAPE ratio stands at 41 — more than double the long-term average of 17.8. Over its full history, the CAPE ratio has surpassed 30 and remained there for at least two consecutive months on only six occasions (including now) during sustained bull markets. Let’s explore what happened in each case.
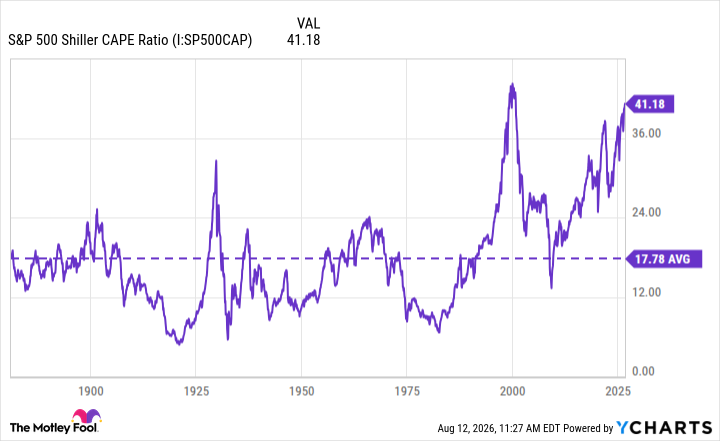
S&P 500 Shiller CAPE Ratio data by YCharts
The first instance occurred between August and September 1929. As illustrated in the chart above, the subsequent stock market crash ushered in the Great Depression. During this period, the Dow Jones fell nearly 89% from peak to trough.
The second episode occurred between June 1997 and August 2001, culminating in the dot-com bubble. Ultimately, the S&P 500 lost 49% of its value while the Nasdaq dropped by 77%.
The period between September 2017 and November 2018 preceded a correction that wiped out roughly 20% from the S&P 500 during the fourth quarter of 2018.
In more recent history, the months spanning December 2019 through February 2020 were followed by the sharp COVID-related recession, which saw a drawdown of approximately 34% in just over a month.
Lastly, the stretch between August 2020 and May 2022 ultimately paved the way to the 2022 bear market. During this period, the S&P 500 declined 25% from peak to trough.
Where is the stock market headed, and how should investors prepare?
Given the analysis above, it’s fair to say that elevated CAPE readings historically signal that subsequent long-term returns are likely to be muted — raising the probability of a meaningful sell-off. With that said, the CAPE ratio does not function as a precise timing instrument.
Stocks can, and often do, remain expensive for extended periods. CAPE readings themselves are not a reliable forecast of the exact month or even year in which a sell-off, correction, or full-blown crash could begin. Moreover, extreme CAPE levels do not guarantee an imminent recession. Against this backdrop, I think the core implication here is one of heightened risk rather than looming catastrophe.
Smart investors can prepare for a correction by emphasizing diversification across asset classes while also maintaining a prudent cash reserve that can be deployed if valuations normalize. Concentrating your portfolio in high-quality companies with durable competitive advantages, consistent free-cash-flow generation, and resilient balance sheets is a winning formula for long-term gains.
This approach does not attempt to predict the stock market’s next move, but strongly positions investors to withstand volatility and capitalize on the inevitable recovery. Remember, despite all the recessions and corrections explored above, the S&P 500 has always recovered and notched new all-time highs, generating steady gains for those who remained patiently invested through volatility.