

(Video released on September 1, 2026)
(※ The latest YouTube report is distributed every week via Official LINE 🎁)
🔻 Click here for the report explaining the September 1st YouTube video!
In the U.S. stock market (S&P 500 index and Dow Jones Industrial Average), there exists a ‘seasonal anomaly’ where returns are significantly skewed toward specific months based on long-term historical data.
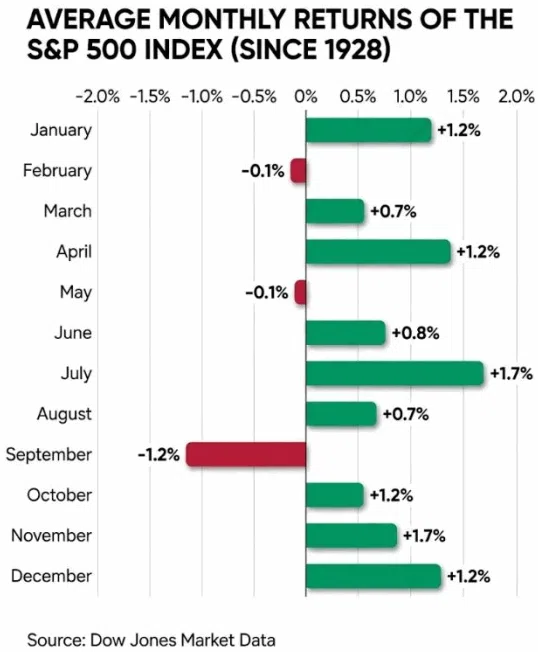
When examining monthly performance data spanning approximately 100 years since 1928, September stands out as the month with the lowest average return and the highest probability of decline throughout the year.
The U.S. stock market in 2026 has performed solidly, recording a year-to-date gain of approximately 17% as of the end of July, but it is now facing seasonal vulnerability from late August through September, as well as rising policy uncertainty associated with the upcoming ‘Midterm Election’ in November.
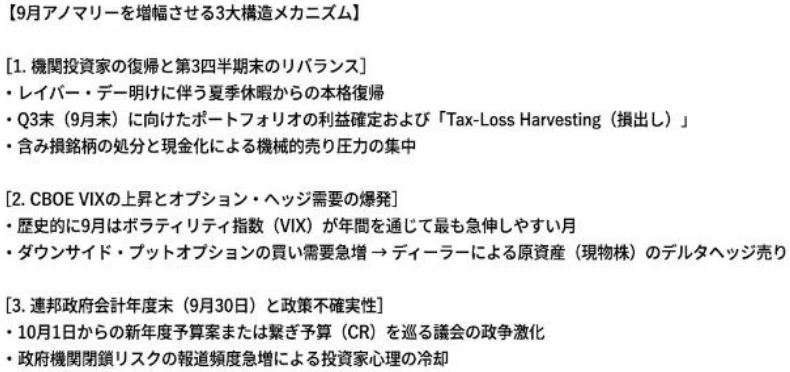
The mechanism behind the September Effect is not merely a fluctuation in market sentiment, but is driven by the following three major structural factors.
-
Large-scale portfolio restructuring by Wall Street institutional investors returning from summer vacation and tax-loss harvesting ahead of the end of the third quarter (Q3).
-
Risks of government shutdowns due to budget confrontations in Congress surrounding the end of the federal fiscal year (September 30) and the failure to pass a provisional budget.
-
A shift in capital allocation toward the bond market following the historical compression of the ‘Equity Risk Premium (ERP),’ which represents the spread between equity earnings yields and long-term interest rates.
Furthermore, the ‘midterm election year,’ which corresponds to the second year of the presidential election cycle, tends to see the greatest expansion in volatility within the four-year cycle, with stock prices strongly suppressed from summer through early autumn.
However, as statistical data since 1950 clearly shows, this uncertainty tends to dissipate rapidly after the ‘mid-October to November voting period,’ transitioning into a historical rebound rally from the end of the year into the following year.
Historical Verification and Statistical Significance of the U.S. Stock ‘September Anomaly’
Tracking monthly performance in the S&P 500 index from 1928 to 2025, September is the only month out of the 12 months of the year to record a clear negative return.
The three major mechanisms forming the September Effect
The sharp decline in performance in September is not a product of chance, but is caused by the institutional schedule of financial markets and the behavioral patterns of market participants.
Institutional investors who return to the market after Labor Day (the first Monday in September) conduct a thorough inventory of their portfolios before finalizing their third-quarter performance results.
A supply-demand structure is formed where profit-taking sales of winning stocks and loss-cutting sales to reduce tax burdens intersect, leading to the highest concentration of supply (selling pressure) in the cash market for the year.
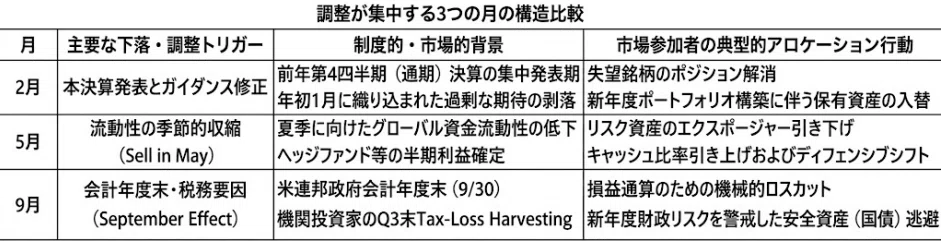
Functional classification of the three major seasonal cycles where the stock market tends to be sluggish (February, May, and September)
The year-end adjustment phase of the stock market does not occur randomly, but is precisely linked to three axes: corporate financial reporting cycles, capital liquidity, and fiscal/institutional events.
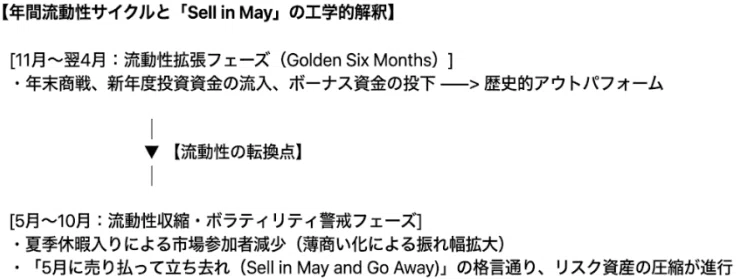
Statistically, it is a proven fact that the average performance for the six-month period from May to October clearly underperforms the performance from November to April of the following year.
Valuation distortions and the extreme compression of the Equity Risk Premium (ERP)
In addition to seasonal factors, the greatest vulnerability facing the U.S. market as of 2026 lies in the collision between high long-term interest rates and the overvaluation of the stock market.
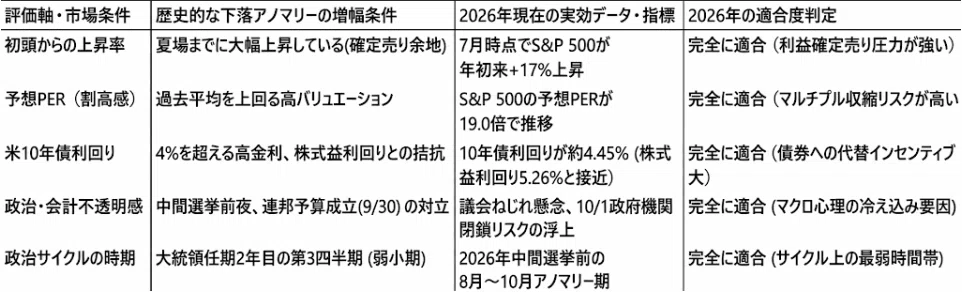
The transformation of asset allocation brought about by persistently high interest rates
When measuring whether stock prices are overvalued or undervalued, not only the single price-to-earnings ratio (PER) but also the relative relationship with bond yields, which are safe assets, becomes extremely important.
In an environment where the U.S. 10-year Treasury yield remains at a high level near 4.45%, holding risk-free bonds provides a guaranteed yield in the mid-4% range.
In contrast, a situation where the earnings yield of stocks maintaining high valuations is closing in on bond yields acts as a powerful incentive for institutional investors’ asset allocation to ‘reduce the ratio of stocks and increase the inclusion of safe bonds’.
The time when this asset shift trigger is most likely to be pulled is September, when portfolio-wide rebalancing takes place.
The four-year presidential cycle and the volatility dynamics unique to ‘midterm election years’
Over the four-year term of a U.S. president, the stock market follows a clear political cycle. Among these, the ‘midterm election year’ that occurs in the second year of a president’s term is known as the year when volatility is highest and annual returns are most likely to stagnate over the four-year period.

The main cause of stock price suppression in midterm election years: policy uncertainty
The greatest selling pressure in a midterm election year is not the deterioration of economic indicators themselves, but rather ‘Economic Policy Uncertainty’ regarding the shifting balance of power in the congressional majority.
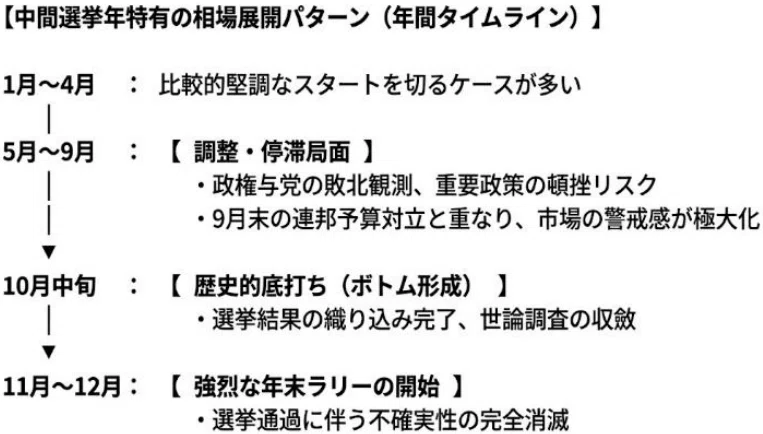
According to historical data, the S&P 500 in a midterm election year has a notably high probability of forming a deep adjustment phase (drawdown) between August and October after hitting highs from the beginning of the year through the summer.
When will U.S. stocks ‘return’: quantitative conditions for bottom formation and reversal timing
The point that investors should watch most closely is ‘when this seasonal and political downward pressure will reverse and under what conditions it will bottom out’.
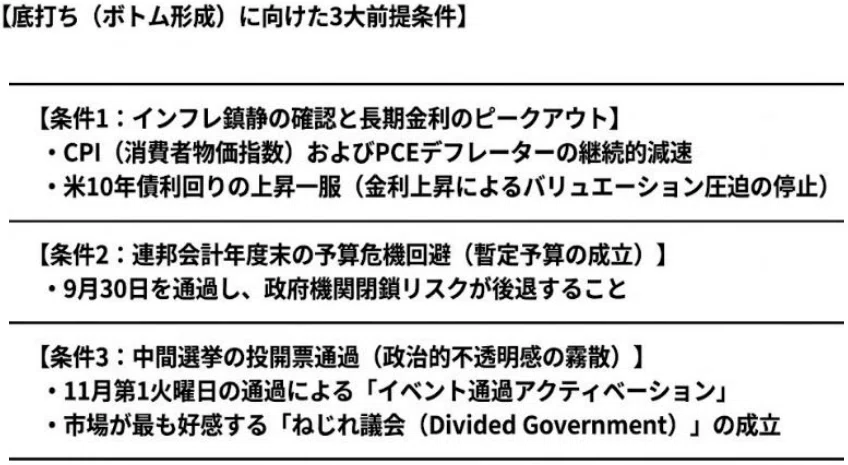
Market dynamics that favor a ‘divided government’
Capital markets tend to favor a ‘divided government’ (where the president’s party and the party with the congressional majority are different) more than the victory of any specific party (Democratic or Republican) itself.
If a divided government is established, it becomes extremely difficult for radical tax increase bills, massive industrial regulations, or unpredictable large-scale legal reforms to pass through Congress.
This ‘policy gridlock’ means that the existing business environment for companies becomes fixed and future projections become easier to make, thus bringing a strong sense of buying security to the market.
The ‘overwhelming win rate from November onwards’ supported by data since 1950
In historical statistics, the S&P 500 has recorded a win rate of nearly 100% and extremely high returns during the ’14-month period from the end of October to December of the following year’ in years when midterm elections were held.
The peak of the decline often occurs in ‘mid-October,’ and the moment the election day (early November) passes, the year-end rally begins as the sidelined capital of institutional investors, who had been refraining from buying, flows back into the market all at once.
Time-Horizon Strategies and Conclusions by Investor Profile
Regarding market developments from September to the end of the year, the approach investors should take is clearly tiered into three levels based on their risk tolerance and analytical capabilities.

Conclusion
The ‘weakness in September’ in the U.S. market is a logical necessity caused by the convergence of Q3-end rebalancing by institutional investors, tax-loss harvesting, fiscal year-end budget political maneuvering, and the compression of the equity risk premium.
Especially in 2026, a midterm election year, the environment is primed for downward pressure from summer to early autumn to manifest more clearly due to the added political uncertainty regarding the administration’s mandate.
However, this adjustment phase from September to October is not an irreversible structural collapse, but rather functions as an ideal setup period (reset period) for the ‘strongest rally phase of the presidential cycle that arrives from the end of the year into the following year.’
The decisive factors for a market reversal are the stabilization of long-term interest rates due to cooling inflation, the passing of fiscal events at the end of September, and the clearing of uncertainty following the establishment of a ‘divided government’ after the November midterm elections.
Investors are required to avoid the folly of panicking and dumping their holdings due to short-term seasonal volatility, and instead implement a disciplined allocation strategy that does not miss the bottom formed in early autumn, after strictly defining their own investment time horizon (September contrarian, October assessment, November trend-following).
📝 Latest YouTube reports and information on
irregularly held study sessions are
available exclusively on our official LINE → https://mykey-hidoutoku.com/yt/
🎁 Multiple benefits for registering on the official LINE
~~~
This is Mikey Sano.
Thank you for watching until the end!
Once you’ve read this, let’s put it into practice!
※ Thank you as always for your comments, likes, and shares!
《🔍️ Please check these out as well》
🎤Voicy (Mikey’s Behind-the-Scenes Stories)👈️
※ Updated every morning at 8:00 AM
▶️YouTube (Mikey’s Immoral Sociology)👈️
✉️Livedoor News List 👈️