

Sho Nakajima | Foreign Exchange Trader
Summary
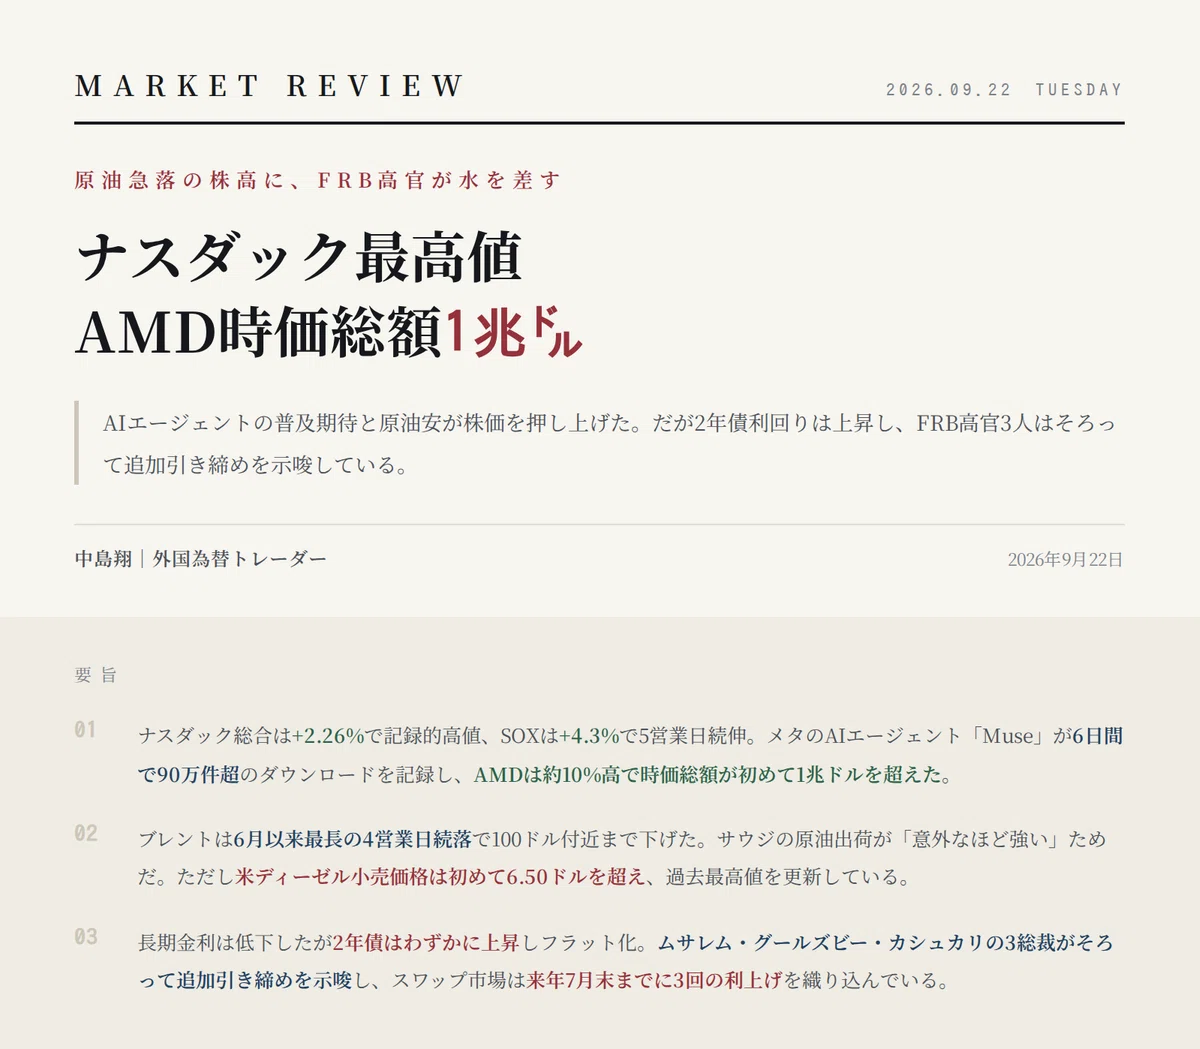
The U.S. stock market began the week with the Nasdaq Composite Index closing at a record high of 27,122.09, up 2.26% from the previous day, fueled by a surge in AI-related stocks and a sharp drop in oil prices. The Nasdaq 100 rose 2.83%, the S&P 500 gained 1.49%, and the Dow climbed 0.71%. The Philadelphia Semiconductor Index rose 4.3%, marking its fifth consecutive day of gains.
The rally was ignited by the strong debut of Meta Platforms’ new AI agent, ‘Muse.’ It recorded over 900,000 downloads in the six days since its release, causing Meta shares to jump over 12% at one point. This triggered buying in CPU-related stocks responsible for AI inference processing, with AMD rising about 10% to exceed a market capitalization of $1 trillion for the first time on a closing basis.
Oil prices plummeted. Brent crude fell for the fourth consecutive day to near $100 per barrel, marking its longest losing streak since June. WTI fell 4.8% to the $95 range. Selling was encouraged by satellite data showing oil shipments from Saudi Arabia remaining ‘surprisingly strong’ and President Trump indicating he would not rule out a meeting with the Iranian president.
However, the interest rate market is telling a different story. While long-term interest rates fell, the 2-year Treasury yield rose slightly, causing the yield curve to flatten. St. Louis Fed President Musalem, Chicago Fed President Goolsbee, and Minneapolis Fed President Kashkari all hinted at the possibility of further tightening, and the swap market is now pricing in three additional rate hikes by the end of July next year.
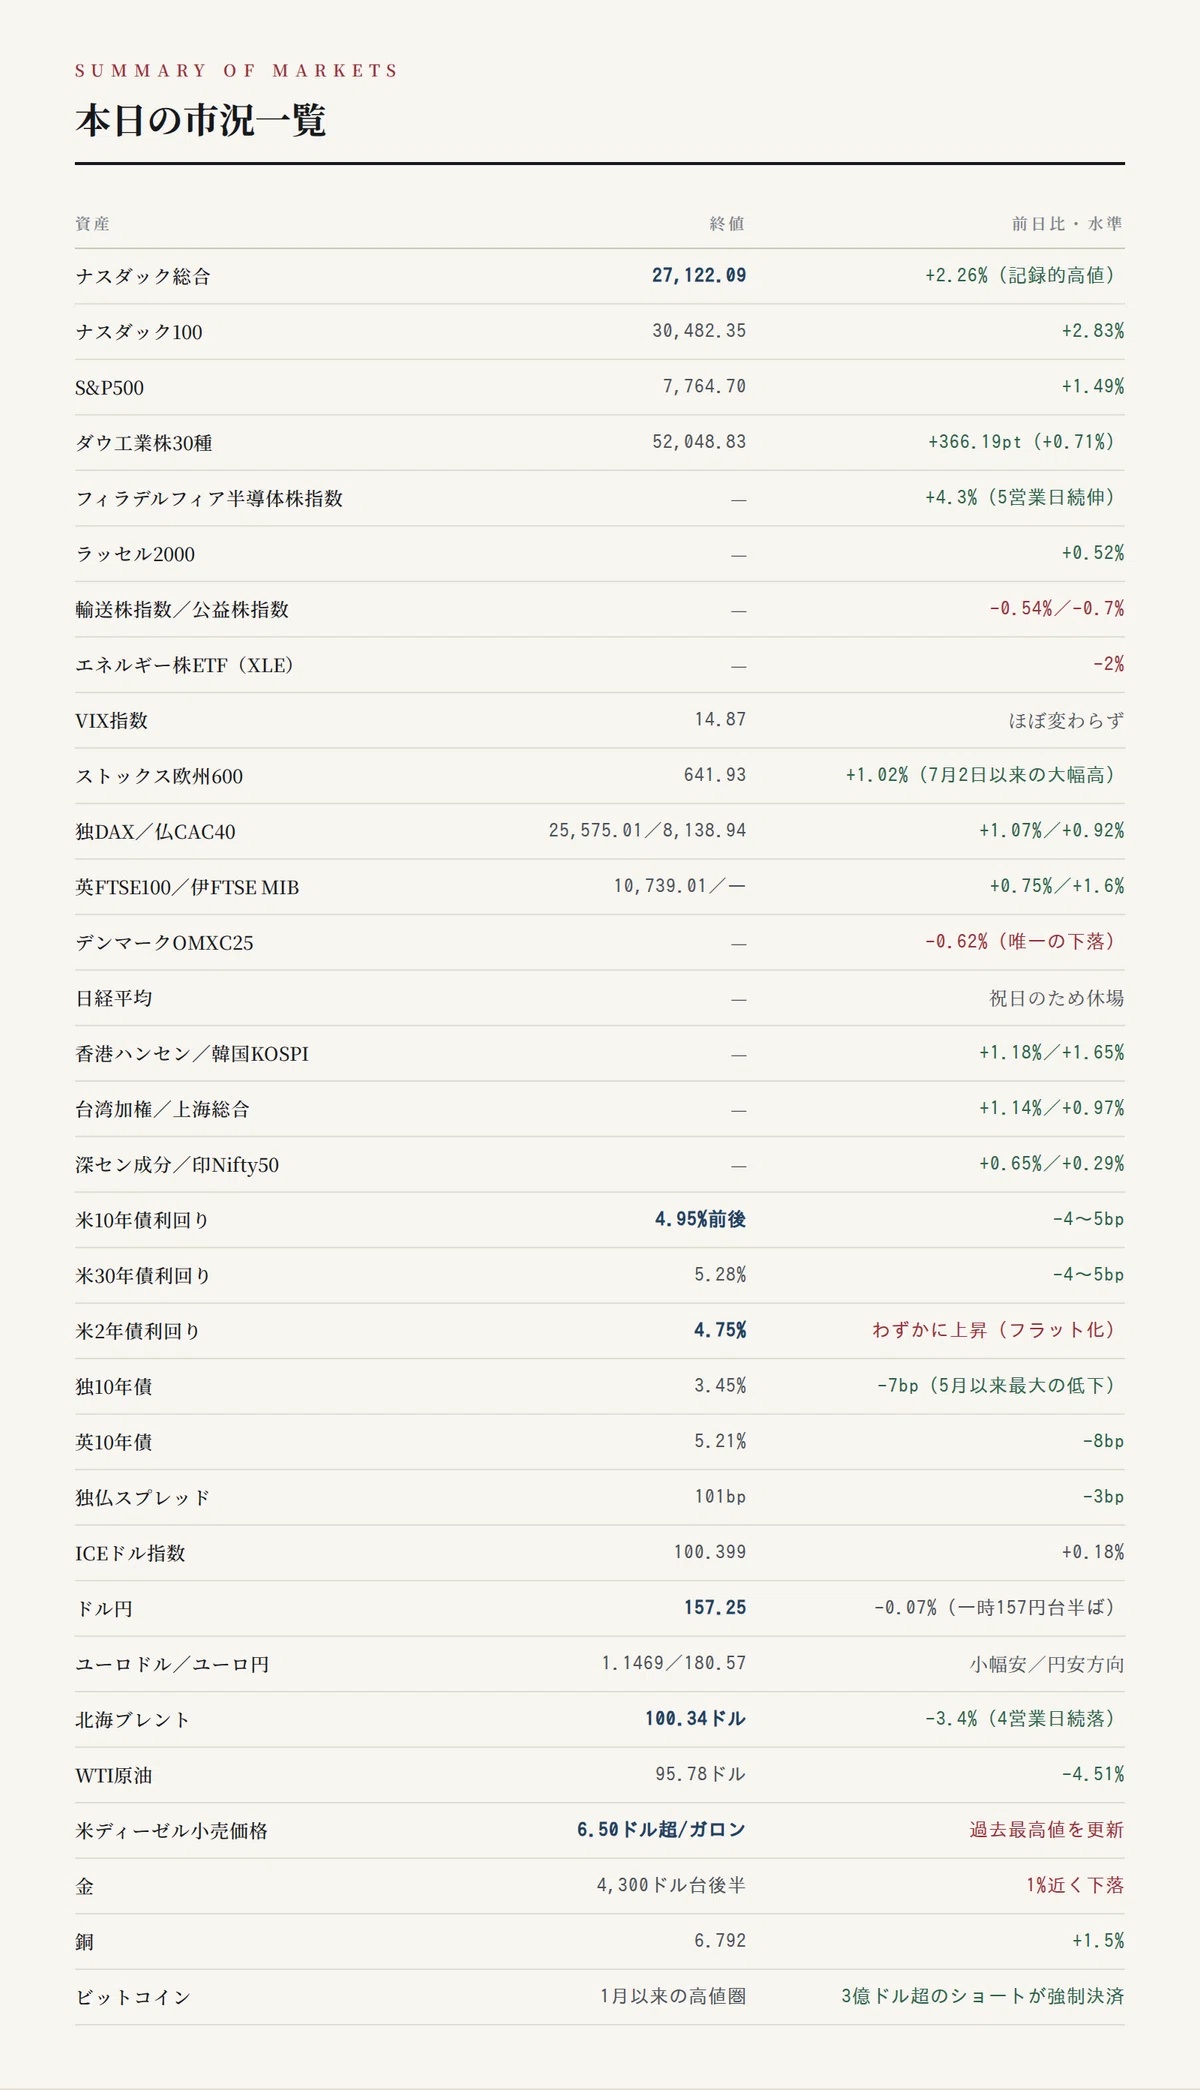
Today’s Market Overview
Asset Closing Price Change/Level Nasdaq Composite 27,122.09 +2.26% (Record High) Nasdaq 100 30,482.35 +2.83% S&P 500 7,764.70 +1.49% Dow Jones Industrial Average 52,048.83 +366.19pt (+0.71%) Philadelphia Semiconductor Index — +4.3% (5th consecutive day of gains) Russell 2000 — +0.52% Transportation/Utility Indices — -0.54%/-0.7% Energy ETF (XLE) — -2% VIX Index 14.87 Nearly unchanged Stoxx Europe 600 641.93 +1.02% (Largest gain since July 2) DAX/CAC 40 25,575.01/8,138.94 +1.07%/+0.92% FTSE 100/FTSE MIB 10,739.01/— +0.75%/+1.6% OMXC25 (Denmark) — -0.62% (Only decliner) Nikkei 225 — Closed for holiday Hang Seng/KOSPI — +1.18%/+1.65% Taiex/Shanghai Composite — +1.14%/+0.97% Shenzhen Component/Nifty 50 — +0.65%/+0.29% U.S. 10-Year Yield 4.95% approx. -4-5bp U.S. 30-Year Yield 5.28% -4-5bp U.S. 2-Year Yield 4.75% Slightly higher (flattening) German 10-Year 3.45% -7bp (Largest drop since May) U.K. 10-Year 5.21% -8bp German-French Spread 101bp -3bp ICE Dollar Index 100.399 +0.18% USD/JPY 157.25 -0.07% (Hit mid-157 range) EUR/USD/EUR/JPY 1.1469/180.57 Slightly lower/Yen weakening Brent Crude $100.34 -3.4% (4th consecutive day of losses) WTI Crude $95.78 -4.51% U.S. Retail Diesel Price Over $6.50/gallon (New record high) Gold High $4,300 range Down nearly 1% Copper 6.792 +1.5% Bitcoin Near January highs, over $300 million in shorts liquidated
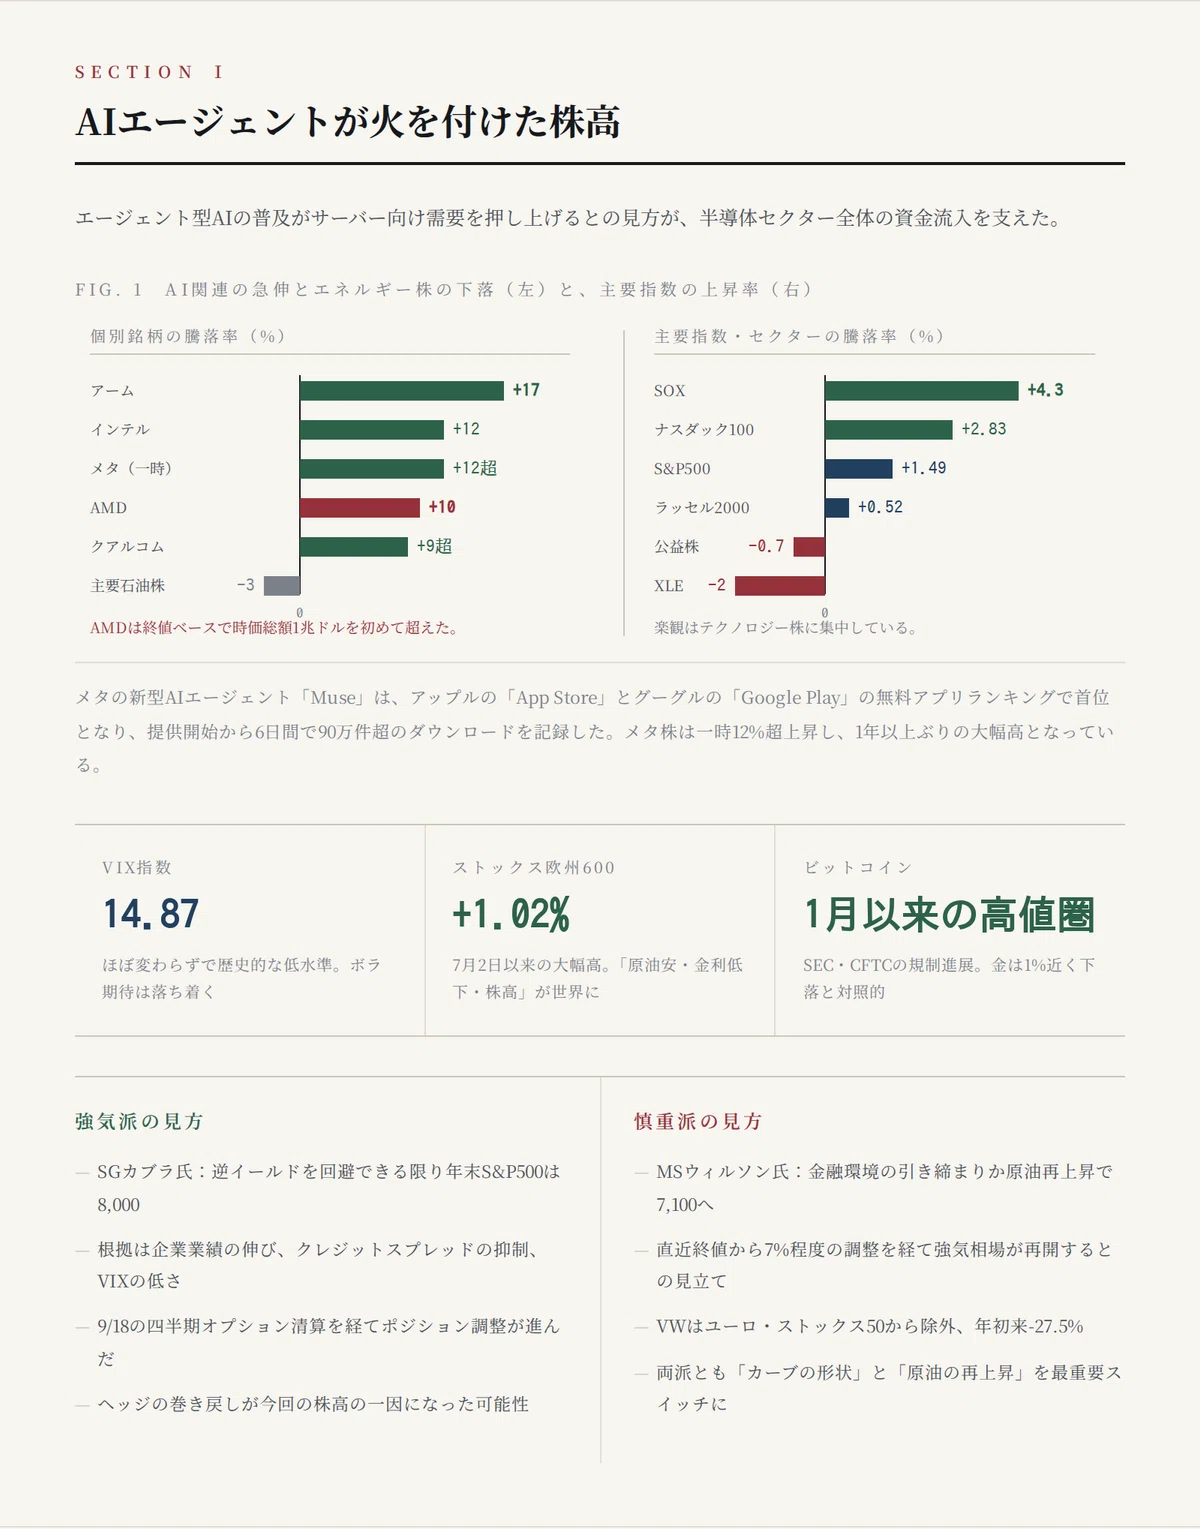
I. Stock Rally Ignited by AI Agents
The day’s stock rally was led by the strong debut of the new AI agent ‘Muse’ launched by Meta Platforms. It topped the free app rankings on Apple’s ‘App Store’ and Google’s ‘Google Play,’ recording over 900,000 downloads in the six days since its release. Meta shares rose over 12% at one point, marking their largest gain in over a year.
In response, buying spread to CPU-related stocks responsible for AI inference processing. AMD shares rose about 10%, exceeding a market capitalization of $1 trillion for the first time on a closing basis. Intel rose around 12%, Qualcomm over 9%, and Arm Holdings surged around 17%. The view that the spread of agent-type AI will boost demand for servers supported capital inflows into the entire semiconductor sector.
As a result, the Nasdaq Composite updated its closing record since June, and the Philadelphia Semiconductor Index rose 4.3%, marking its fifth consecutive day of gains.
However, there are limits to the breadth of the buying. The main drivers of the stock rally were concentrated on the two themes of oil and AI, while energy stocks were sold off instead. The XLE, an oil and gas sector ETF, fell 2%, while ConocoPhillips, ExxonMobil, and Occidental Petroleum each fell around 3%. The combination of growth outperformance and energy underperformance is a textbook capital flow: lower interest rates provide a tailwind for growth stocks by supporting valuations, while lower oil prices act as a headwind for energy stocks by weakening earnings assumptions.
The small-cap Russell 2000 rose 0.52%, a more modest gain compared to mega-caps, while transportation stocks fell 0.54% and utility stocks fell 0.7%. The VIX remained nearly unchanged at 14.87, still at historically low levels. Behind the stock rally, market-wide volatility expectations remain calm, suggesting that optimism is concentrated in technology stocks.
Overseas markets were also generally firm. The European Stoxx 600 index rose 1.02%, marking its largest gain since July 2, while the Hong Kong Hang Seng index rose 1.18% and the South Korean KOSPI rose 1.65%, all riding the risk-on wave. The Japanese market was closed for a holiday. It can be confirmed that the same causal structure of ‘lower oil prices, lower interest rates, and higher stock prices’ was spreading globally.
The outlook is divided between bulls and cautious observers. A team led by Michael Wilson at Morgan Stanley warned that if financial conditions tighten further or oil prices rise again, the S&P 500 could correct to 7100 (a decline of about 7% from the recent closing price) before resuming its bull market toward the end of the year. Meanwhile, Manish Kabra of Société Générale, citing corporate earnings growth, suppressed credit spreads, and low VIX, has indicated that as long as an inverted yield curve can be avoided, the S&P 500 could reach 8000 by year-end.
The divergence point between bulls and bears is common, and the fact that both cite the ‘shape of the yield curve’ and the ‘presence or absence of a resurgence in oil and energy prices’ as the most important switches serves as an easy-to-understand monitoring axis for investors.
On the supply and demand side, it has been pointed out that position adjustments progressed significantly following the simultaneous quarterly option expiration on September 18. It appears that investors had been reducing exposure and increasing hedges ahead of the FOMC, and the unwinding of these positions may have been a factor in the current stock market rally.
Contrasting movements were also notable in Europe. Volkswagen was removed from the Euro Stoxx 50, a major European stock index. Its stock price is down 27.5% year-to-date and near its lowest level since 2010, and the company is in the midst of a business restructuring that involves cutting 100,000 jobs. In contrast to the euphoria surrounding AI and semiconductors in US stocks, this reflects the structural problems facing Europe’s traditional manufacturing sector.
Bitcoin gained value. With the US SEC opening a tentative path to allow trading of tokenized stocks and the US CFTC presenting regulatory proposals for crypto assets, regulatory uncertainty has eased, and it has risen to its highest level since January. It is estimated that over $300 million in short positions were forcibly liquidated in the past 24 hours. The dynamic where gold is sold off by nearly 1% due to rising interest rates while Bitcoin is bought on a different narrative of regulatory progress shows that investors are clearly distinguishing between ‘gold as a safe asset’ and ‘crypto assets reflecting regulatory progress’.
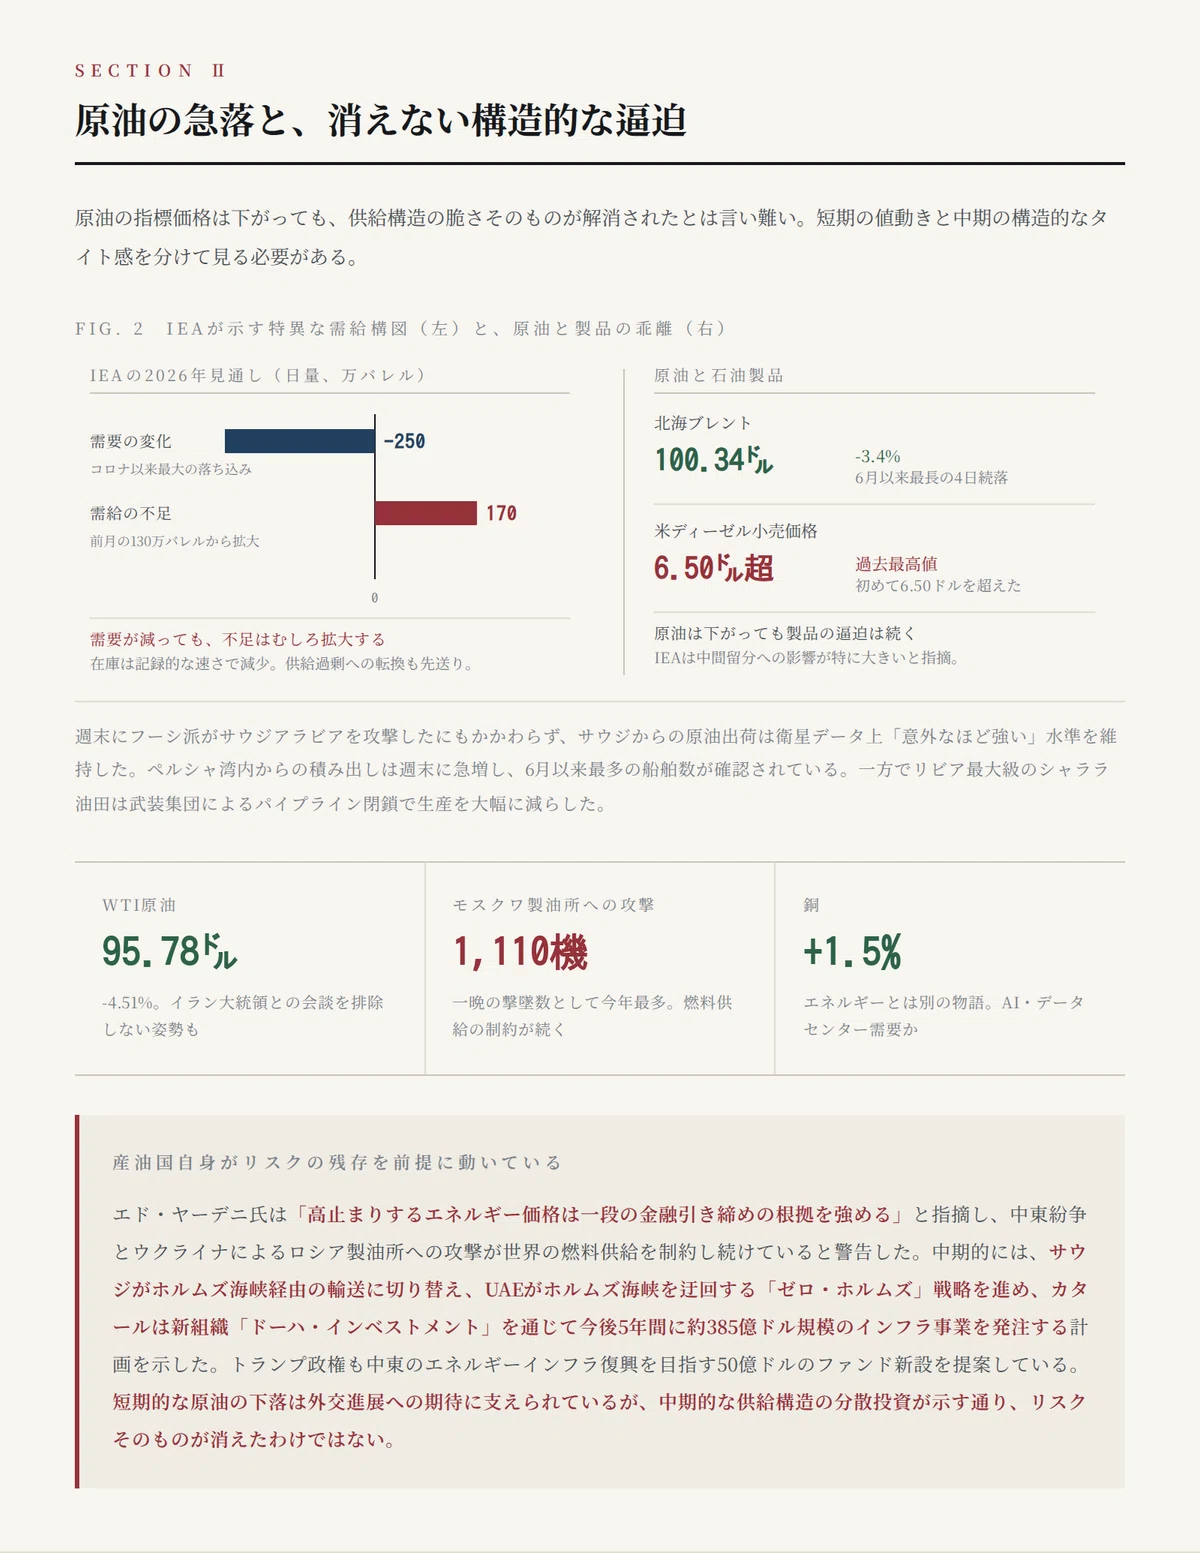
II. The Plunge in Oil and the Persistent Structural Tightness
In the commodity market, the sharp drop in oil was the biggest move. November Brent crude fell 3.4% from the previous day to $100.34 per barrel, marking its longest losing streak of four consecutive trading days since June. October WTI also fell 4.51% to $95.78.
The background to this is that the reality of supply is stronger than expected. Despite attacks by the Iranian-backed Houthi militia on Saudi Arabia with missiles and drones over the weekend, oil shipments from Saudi Arabia remained at ‘surprisingly strong’ levels according to satellite data. Shipments from the Persian Gulf surged over the weekend, with the highest number of vessels confirmed since June. The suspension of the East-West pipeline leading to the Red Sea was replaced by transport via the Strait of Hormuz. According to US Central Command, oil and LNG transport through the strait over the past two weeks is at a six-month high.
Diplomatic expectations have also been added. President Trump indicated that he would ‘probably’ not rule out a meeting with Iranian President Pezeshkian in conjunction with the UN General Assembly. According to The Wall Street Journal, the Trump administration has proposed a new $5 billion fund aimed at rebuilding energy infrastructure in the Middle East, and there are moves to create a sense of calm in the Middle East through both diplomacy and reconstruction support.
However, it is premature to conclude that the decline in oil is a one-way trend. Saudi Arabia issued air raid warnings for the capital Riyadh and Yanbu on the Red Sea coast over the weekend, and production at Libya’s largest Sharara oil field was significantly reduced due to a pipeline closure by an armed group.
And above all, the tightness in petroleum products continues. U.S. retail diesel prices have exceeded $6.50 per gallon for the first time, hitting a record high. Even as crude oil prices fall overall, persistent upward pressure remains on distillates due to tight supply and demand. Ed Yardeni pointed out that “persistently high energy prices strengthen the case for further monetary tightening,” warning that the Middle East conflict and Ukraine’s attacks on Russian refineries continue to constrain global fuel supplies. In fact, after Moscow’s refineries were hit by Ukrainian drone strikes, the Russian Ministry of Defense announced that it had shot down 1,110 drones overnight, the highest number this year.
The IEA’s outlook highlights a peculiar composition of supply and demand. The IEA has revised down its 2026 global oil demand forecast, projecting a decline in demand of 2.5 million barrels per day. This is the largest drop since the COVID-19 pandemic and is expected to be on a scale comparable to the four largest demand shocks of the past 60 years. The impact is particularly significant on middle distillates like diesel and feedstocks for petrochemical plants in Asia.
However, despite the shrinking demand, the IEA projected that the global oil supply deficit for this year would average approximately 1.7 million barrels per day, an increase from the 1.3 million barrels per day estimated in the previous month’s report. Global oil inventories are falling at a record pace, and the shift to a supply surplus, initially expected in 2027, has been postponed. Supply-side constraints are having a stronger effect than the pace of demand decline, creating a complex situation where demand contraction and inventory depletion are occurring simultaneously.
In the medium term, Gulf oil-producing nations themselves are proceeding with structural adjustments based on the premise that risks will persist. Saudi Arabia is shifting to transport via the Strait of Hormuz, while the United Arab Emirates is pursuing a “Zero-Hormuz” strategy to bypass the strait. Qatar has reorganized the management structure of its sovereign wealth fund and announced plans to award approximately $38.5 billion in infrastructure projects over the next five years through a new organization, “Doha Investment.” While the short-term drop in crude oil is supported by “good news” in the form of expectations for diplomatic progress, the risk itself has not disappeared, as evidenced by the diversification of medium-term supply structures.
Non-ferrous metals are telling a different story. While natural gas fell 2.85%, copper rose 1.5%. This may reflect capital expenditure demand related to AI and data centers, as well as expectations for China’s economic stimulus, and it is worth noting that different narratives are unfolding simultaneously for energy and non-ferrous metals.
III. Flattening Yields and Hawkish Remarks from Three Fed Officials
In terms of interest rates, yields in the long-term zone fell noticeably following the sharp drop in crude oil. The U.S. 10-year Treasury yield fell 4-5 basis points from the previous day to around 4.95%, and the 30-year yield fell by a similar amount to 5.28%. Meanwhile, the short-term zone showed a contrasting movement. The 2-year Treasury yield rose slightly to 4.75%, and the 6-month and 1-year yields also saw slight increases.
In other words, the day was characterized by a “flattening” where long-term interest rates fell while short-term rates remained largely unchanged or rose slightly. This movement signifies a dual structure where the market views the sharp drop in crude oil as a “retreat of immediate inflationary pressure,” while remaining conscious of continued tightening regarding the short-term policy rate path.
As if to confirm the expectation of continued tightening, hawkish remarks emerged one after another from Fed officials.
St. Louis Fed President Musalem stated that the current policy rate range of 3.75-4.00% is “still on the accommodative side.” He noted that both persistent demand and recurring supply factors are keeping inflation risks elevated, and without additional policy tightening, it is more likely that the inflation rate will remain above the 2% target 18 months from now.
Chicago Fed President Goolsbee warned that monetary policy cannot ignore frequent and prolonged supply shocks, and that curbing inflation may involve pain in the labor market.
Minneapolis Fed President Kashkari also pointed out that inflation is not just an issue of crude oil prices, but extends to all areas of the economy, including the service sector.
All three statements suggest that this rate hike is not a “one-off adjustment,” but a continuous process that includes the possibility of further tightening. In the swap market, three additional rate hikes are priced in by the end of July next year, and a tense relationship remains between the “interest rate stability” assumed by the stock market and the “continued tightening” indicated by the interest rate market.
There is another perspective regarding the level of long-term interest rates themselves. Even when the 10-year Treasury yield rose to 5% on Friday, the 10-year breakeven inflation rate had fallen to around 2.33%. Since yields are rising despite falling inflation expectations, it is highly likely that a rise in real interest rates is the primary factor.
George Cole, head of European interest rate strategy at Goldman Sachs, points out that we should pay attention to the nature of the recent rise in long-term interest rates. When averaging US, German, UK, and Japanese government bond yields by maturity, all maturities are rising, but volatility has not notably increased in the process. He states that the fact that the market is accepting higher interest rates without turmoil or anxiety makes it difficult to say that current interest rate levels are in a state of so-called ‘mispricing’. If current interest rate levels are formed based on fundamentals, then for interest rates to fall again, changes in those fundamentals themselves would be necessary is his view.
Meanwhile, Ed Yardeni has reiterated his view that the 10-year Treasury yield will soon hit a ceiling. The 10-year yield rose from 4.76% at the end of August to 4.96% on September 9, but he notes that the tendency for September to be known as the ‘cruelest month’ in the stock market is strongly manifesting in the bond market this time, and the worse the month, the better the buying opportunity. As a basis, he cites the possibility that Treasury Secretary Bessent will trigger some kind of powerful measure, a ‘bazooka’ so to speak, to prevent yields from surging past 5.00%.
The rise in long-term interest rates is creating a unique mismatch in the corporate bond market. While investor demand is concentrated in long-term corporate bonds, issuing companies are increasingly tending to avoid long-term financing. A 30-year bond issued by insurance broker Aon received five times the issuance amount in applications, while a 30-year bond from pharmaceutical company GSK received about ten times the amount. The average remaining maturity of the US investment-grade corporate bond market has already shortened from a peak of 12.4 years to 10.3 years, and the duration has also fallen from about 8.8 five years ago to around 6.5. This is a reflection of companies being wary of the risk that borrowing costs will remain high for decades and switching to shorter-term issuance, which creates another problem: a shortage of the long-term bonds needed by life insurance companies and pension funds.
In the foreign exchange market, the dollar remained firm. The ICE Dollar Index rose 0.18% to 100.399. The background to the dollar not being sold off even as long-term interest rates fell lies in expectations that short-term interest rates will remain high and the relatively hawkish stance of US monetary policy compared to other major central banks.

IV. Market Internals and Sentiment—Diverging Readings
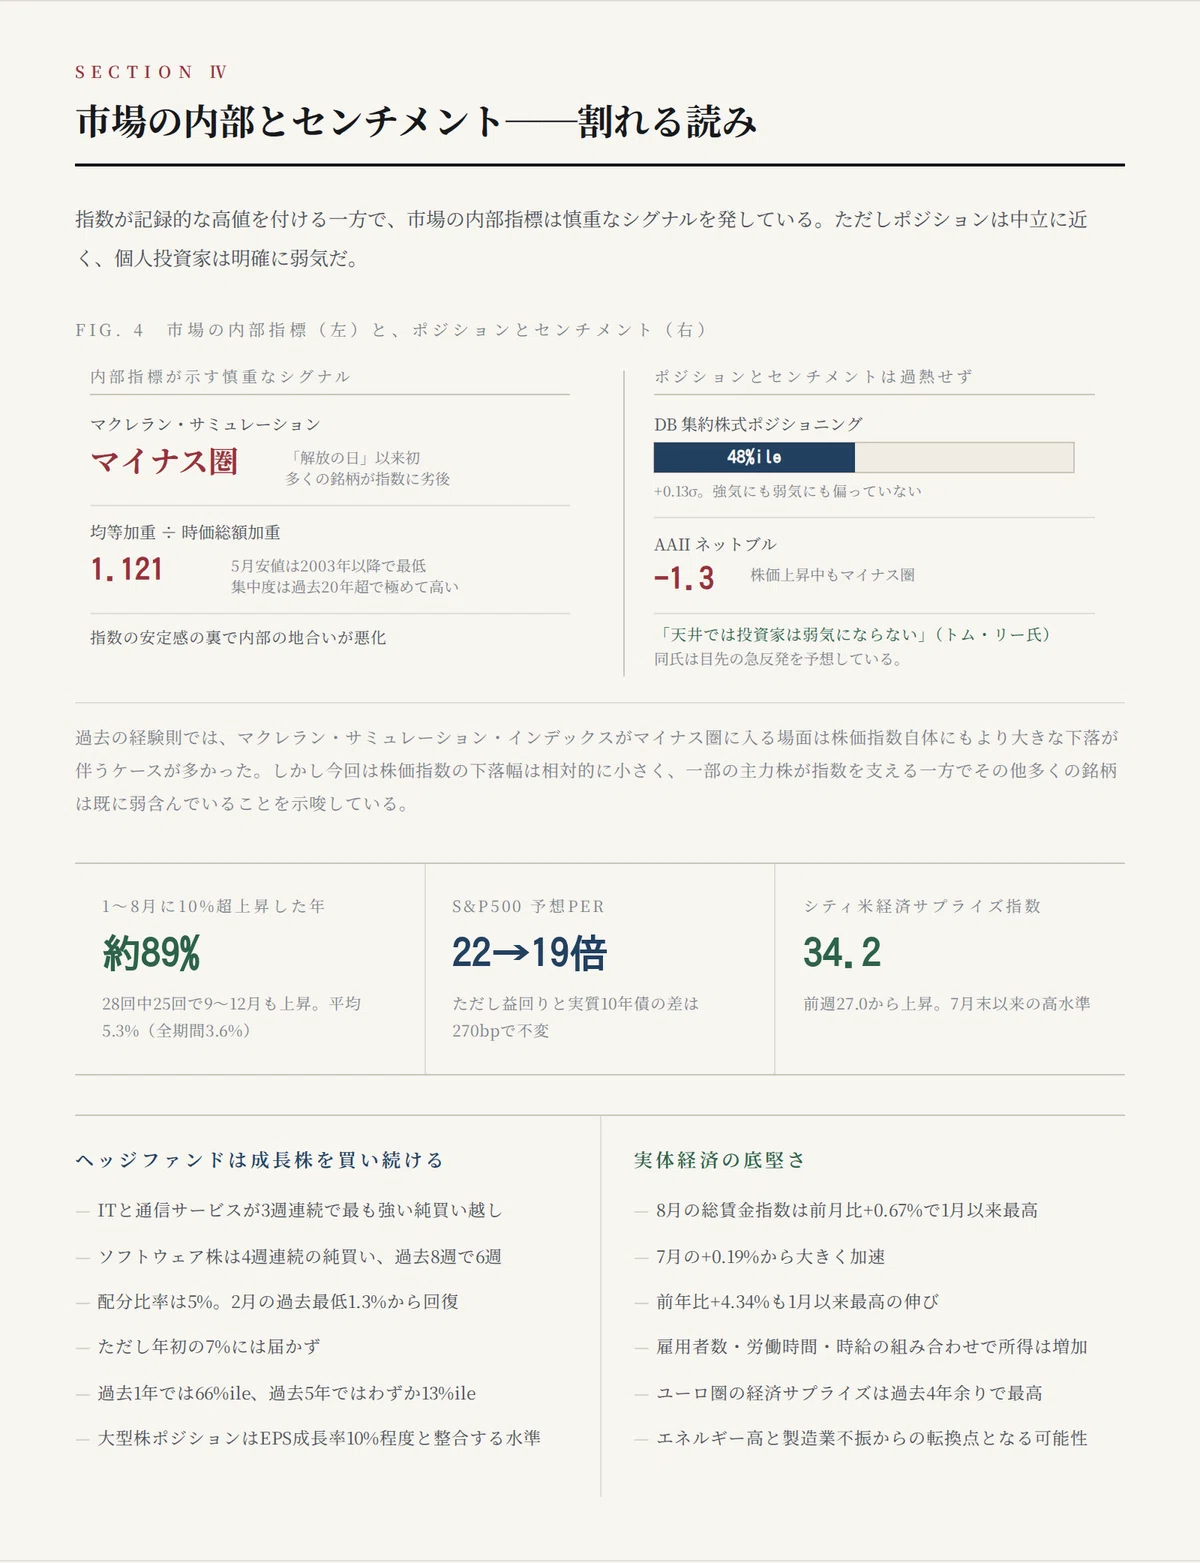
While indices are hitting record highs, market internal indicators are sending cautious signals.
The McClellan Summation Index has fallen into negative territory. This is said to be the first time since the market correction following the so-called ‘Liberation Day’ shock. This index is the cumulative difference between the number of daily advancing and declining stocks, and falling into negative territory means that many individual stocks that make up the market are underperforming the movement of the index as a whole.
According to past empirical rules, instances where this index enters negative territory have often been accompanied by larger declines in the stock indices themselves. However, this time, the decline in the stock indices themselves is relatively small compared to similar past situations. This discrepancy suggests that while some leading stocks pushing up the index as a whole continue to show relatively strong movement, many other stocks are already weakening.
Concentration in large-cap stocks also continues. The ratio of the S&P 500 equal-weighted index to the market-cap-weighted index has recently 1.121 and continues to show a downward trend. The low recorded in May 2026 is the lowest level since 2003, and although there was a scene where it recovered once after that, it has recently turned downward again. This indicates that the current level of concentration in the stock market is at an extremely high level compared to the last twenty-plus years.
Even so, positioning remains close to neutral. The aggregate equity positioning indicator calculated by Deutsche Bank fell this week to plus 0.13 standard deviations, the 48th percentile. Investors as a whole are not significantly biased toward either bullish or bearish sentiment. Large-cap positioning is also at plus 0.35 standard deviations, the 65th percentile, which is merely a level consistent with a situation where S&P 500 EPS growth is roughly 10% year-over-year. While the ongoing growth boom is considered to be of an “unprecedented” scale, positioning has not built up to that extent.
Retail investors are clearly bearish. The AAII net bull indicator (bullish ratio minus bearish ratio) shown by Tom Lee of Fundstrat remains submerged in negative territory at minus 1.3 recently. In contrast to the 2023–2024 and 2025 rallies where retail investors were bullish, the indicator has remained in negative territory during the 2026 rally, despite stock prices continuing to rise.
Based on the rule of thumb that investors do not become bearish at the peak of a stock market rally, Lee argues that the market has not yet hit its peak. He believes that the fact that many investors are cautious due to seasonal weakness is itself evidence that bad news has already been priced into stocks.
Seasonal data also supports this view. According to analysis by ClearBridge Advisors, there have been 28 cases since 1950 where the S&P 500 rose by more than 10% between January and August, and **in 25 of those cases, stock prices also rose from September to December.** The hit rate is approximately 89%, and the average return during this period is about 5.3%, exceeding the all-period average of 3.6%.
Valuation readings are split. According to Goldman Sachs, the S&P 500’s 12-month forward P/E ratio has fallen from 22x at the start of the year to 19x currently. However, the spread between the expected earnings yield of 5.2% and the real 10-year Treasury yield of 2.6% is 270 basis points, which has remained relatively constant over the past two years. The equity risk premium derived from the dividend discount model is also stable at around 3%. Although the sense of overvaluation in stock prices themselves has receded, in terms of relative valuation considering interest rate levels, there has been no major change in the magnitude of the additional return investors demand for stocks.
Hedge funds continue to buy growth stocks. According to Goldman Sachs’ analysis, the information technology and communication services sectors recorded the strongest net buying among U.S. stocks for the third consecutive week. Hedge funds have been net buyers of software stocks for four consecutive weeks and have been net buyers in six of the past eight weeks. The allocation ratio to software stocks is currently 5%, and although it has recovered significantly from the record low of 1.3% recorded in February of this year, it has not yet reached the 7% level seen at the beginning of the year. Compared to the past year, it is at the 66th percentile, but when compared over the past five years, it remains at only the 13th percentile.
Real economy indicators show resilience. The Citigroup Economic Surprise Index for the U.S. rose to 34.2, improving from 27.0 the previous week to reach the highest level since the end of July. The total wage index for private-sector employees in August increased by 0.67% month-over-month, the highest growth since January, a significant acceleration from the 0.19% increase in July. Year-over-year, it is also up 4.34%, the highest growth since January. Even if the growth in the number of employees is moderate, if combined with longer working hours and wage increases, the total income flowing into households will steadily increase.
Improvements are also seen in the Eurozone. According to Goldman Sachs, the number of cases where actual economic indicators in the Eurozone exceed prior expectations is at its highest in over four years. For the Eurozone, which has been in a relatively weak situation for the past few years due to rising energy prices and manufacturing sluggishness, this could be a turning point.
V. European Political Risk and the Future of the Yen, U.S., and China
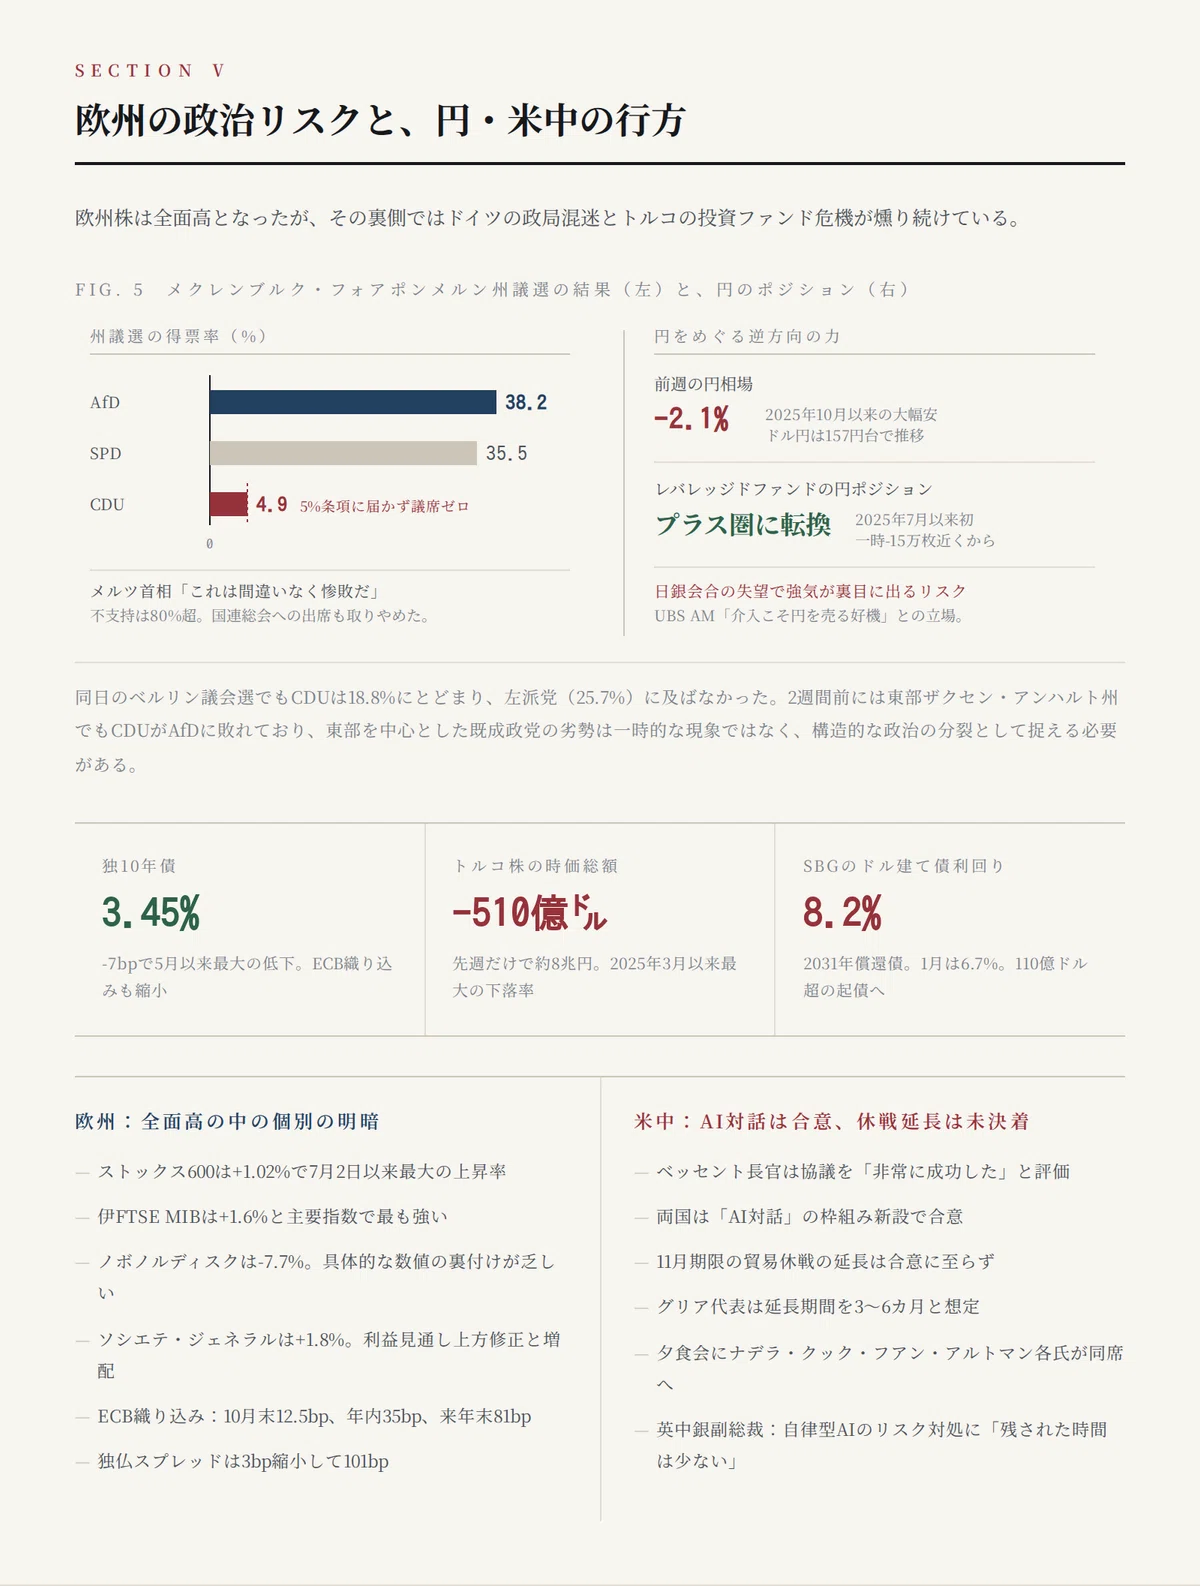
European stocks rose across the board on the 21st. The Stoxx Europe 600 index closed at 641.93, up 1.02% from the previous day, marking its largest daily gain since July 2. Italy’s FTSE MIB was the strongest among major indices, rising 1.6%, while the German DAX closed up 1.07% and the French CAC 40 rose 0.92%. The only index to fall was Denmark’s OMXC25, weighed down by a 7.7% plunge in Novo Nordisk, which has a large weighting in the index. The company announced plans to launch more than five major drugs over the next few years to generate over $23 billion in sales, but the lack of concrete supporting figures that investors were looking for triggered disappointment-driven selling.
In the financial sector, Société Générale rose 1.8%. Investors welcomed the upward revision of its full-year profit outlook and the announcement of a dividend increase policy. Theoretically, lower interest rates tend to squeeze bank margins, but company-specific factors such as earnings and shareholder returns outweighed the macro headwinds.
European interest rates fell significantly. The yield on the 10-year German Bund **fell 7bp to 3.45%**, marking the largest decline since May. The 10-year UK Gilt yield also fell 8bp to 5.21%. This was driven by falling oil and natural gas prices, which eased inflationary pressures and dampened expectations for further ECB rate hikes. The ECB rate hike path priced into short-term money markets is 12.5bp by the end of October, 35bp by year-end, and 81bp by the end of next year, all of which are smaller than previously anticipated. The German-French spread narrowed by 3bp to 101bp.
However, behind the stock market gains on this day, political turmoil in Germany continued to simmer. The Christian Democratic Union (CDU), led by Chancellor Merz, suffered a historic defeat in the state parliamentary election in Mecklenburg-Vorpommern, receiving only 4.9% of the vote, failing to reach the 5% threshold required to win seats. The far-right party Alternative for Germany (AfD) doubled its support to win 38.2%, surpassing the Social Democratic Party (35.5%), which had long been dominant in the state. In the Berlin state election held on the same day, the CDU only reached 18.8%, falling short of the Left Party (25.7%).
Immediately after the exit poll results were released, Merz stated, “This is undoubtedly a disastrous defeat.” Multiple surveys indicate that Merz has the lowest approval rating of any post-war German chancellor, with the percentage of respondents saying they are dissatisfied with the Chancellor’s performance exceeding 80%, while those who are satisfied have fallen to around 10%. Merz canceled his planned attendance at the UN General Assembly in New York this week. Two weeks ago, the CDU also lost to the AfD in the eastern state of Saxony-Anhalt, and the weakness of established parties, particularly in the east, should be viewed not as a temporary phenomenon but as a structural political fragmentation.
The market’s reaction on this day was dominated by lower interest rates and higher stock prices driven by energy prices, and there is little evidence that concerns over German politics were clearly reflected as a discount in German government bonds or the DAX. However, if political fragmentation continues, there is a risk that the ability to implement structural reforms, such as pension and tax reform, will be impaired, potentially weighing on Germany’s potential growth rate and fiscal sustainability in the medium term.
In Turkey, the government has tightened regulations following turmoil in the investment fund industry. The assets of several investment firm executives have been frozen, 25 people are subject to legal proceedings, and 15 have been detained. The Istanbul 100 index fell nearly 3% at one point, and nearly 100 small and mid-cap stocks hit their daily limit lows. The Turkish stock market lost approximately $51 billion (about 8 trillion yen) in market capitalization last week alone, and the all-share index recorded its largest decline since March 2025. Assets under management in investment funds have decreased by 510 billion lira in less than three weeks since the end of August, and regulators have extended the liquidation period for funds from three months to six months. Credit events in emerging markets often start quietly and later spill over into risk premiums for the entire market.
In the currency market, pressure for a weaker yen continues. The dollar-yen pair remained at a high level, trading around 157.25 yen, despite a slight decline, and was sold down to the mid-157 yen range during the day. The yen fell 2.1% last week, marking its largest decline since October 2025.
Kevin Zhao of UBS Asset Management does not view the Bank of Japan’s rate hike as a hawkish pivot, pointing out that “the fundamental policy leading to a weaker yen has not changed.” Since the U.S. is also continuing to raise rates, the Japan-U.S. interest rate differential is likely to be maintained, and he holds the position that if Japanese authorities intervene to buy yen again, that would be the perfect opportunity to sell the yen. This is also against the backdrop of Prime Minister Takaichi maintaining a policy of supporting the economy through fiscal spending. The probability of a rate hike at the next meeting in October, as priced into the swap market, remains below 20%, but it rises to about 90% for the December meeting.
However, hedge fund positions have turned in the opposite direction. According to CFTC data, the net position of leveraged funds in Japanese yen traded on the CME has turned positive for the first time since July 2025, meaning they have shifted toward buying the yen. Yen-selling positions, which had expanded to nearly minus 150,000 contracts at one point in 2026, have shrunk rapidly recently and turned into positive territory in the data as of September 15. There are also indications that CTAs have increased their long positions in the yen against the dollar. However, because the BOJ meeting on the 18th disappointed the market, which had expected a clearer hawkish stance, these bullish positions carry the risk of backfiring. With thin trading due to a holiday in Japan, reports of rate checks by authorities have been circulating, and speculation about intervention could make the yen’s price movements even more volatile.
Attention must also be paid to the financing supporting AI investments. SoftBank Group, in order to secure funds for additional investment in OpenAI, is aiming to issue one of the largest speculative-grade bond offerings in history, totaling over $11 billion. The yield on the company’s dollar-denominated bonds maturing in 2031 rose to 8.2% at one point this month, up significantly from 6.7% in January. The cost of insurance against credit risk has also recently risen to a three-year high. The structure where AI investment is expanding driven by borrowing is a source of earnings expectations for the stock market, while simultaneously creating a sense of caution in the credit market.
Regarding US-China relations, groundwork has been laid for the summit meeting on the 24th. The US side evaluated the meeting in New York between Treasury Secretary Bessent and Chinese Vice Premier He Lifeng and others as “very successful,” and both countries agreed to establish a new framework for dialogue on AI. The Chinese side also evaluated it as “candid, in-depth, and constructive.” However, no agreement has been reached on extending the trade truce that expires in November, and USTR Representative Greer stated that while he expects an extension period of 3 to 6 months, he also said that full trust cannot yet be placed due to uncertainties surrounding China’s rare earth export restrictions.
Leaders of the US technology industry, including Microsoft CEO Nadella, Apple Chairman Cook, Nvidia CEO Huang, and OpenAI CEO Altman, are expected to attend the summit dinner, symbolizing that the AI development race itself has become the main battlefield of US-China relations. The fact that Bank of England Deputy Governor Breeden stated that “time is running out” to address the risk of market disruption by autonomous AI also reflects the same tension of rapid AI adoption and lagging regulatory development.
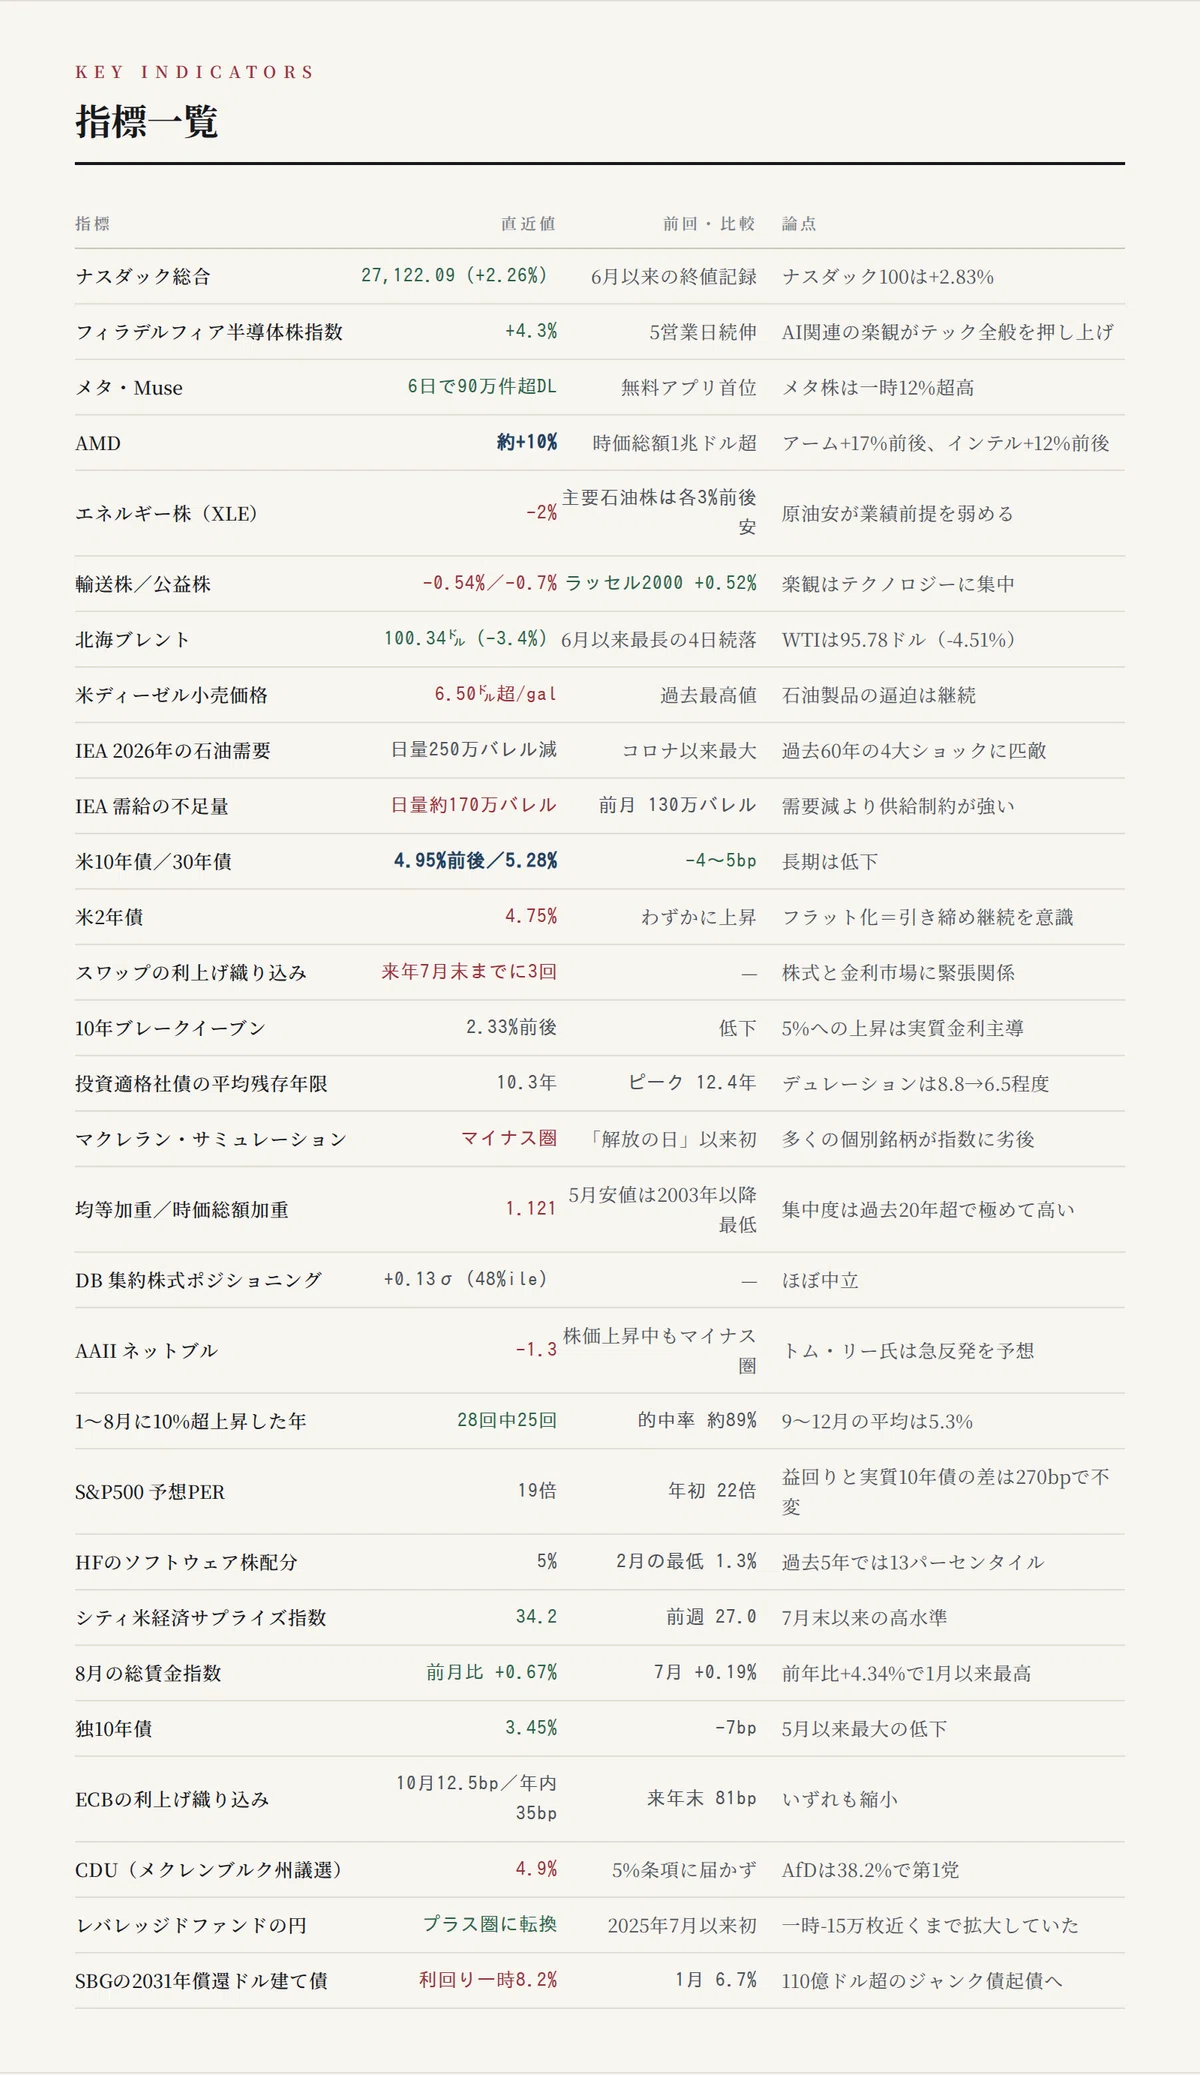
Indicator List
Indicator | Latest Value | Previous/Comparison | Key Point | Nasdaq Composite | 27,122.09 (+2.26%) | New closing record since June | Nasdaq 100 is +2.83% | Philadelphia Semiconductor Index | +4.3% | 5th consecutive day of gains | Optimism regarding AI is pushing up technology in general | Meta Muse | Over 900,000 DLs in 6 days | #1 in free app rankings | Meta stock rose over 12% at one point | AMD | Approx. +10% | Market cap exceeds $1 trillion for the first time | Arm +17% range, Intel +12% range | Energy stocks (XLE) | -2% | Major oil stocks down around 3% each | Lower oil prices weaken earnings assumptions | Transportation/Utility stocks | -0.54% / -0.7% | Russell 2000 is +0.52% | Optimism is concentrated in technology | Brent Crude | $100.34 (-3.4%) | 4th consecutive day of decline, longest since June | WTI is $95.78 (-4.51%) | US retail diesel price | Over $6.50/gallon | New record high | Tightness in petroleum products continues | IEA | 2026 oil demand | Down 2.5 million barrels/day | Largest drop since COVID | Comparable to the 4 major shocks of the past 60 years | IEA | Supply-demand deficit | Approx. 1.7 million barrels/day | Previous month 1.3 million barrels | Supply constraints are stronger than demand decline | US 10-year/30-year bond | Approx. 4.95% / 5.28% | -4 to -5bp | Long-term rates are falling | US 2-year bond | 4.75% | Slightly up | Flattening = awareness of continued tightening | Swap rate hike pricing | 3 hikes by end of July next year | — | Tense relationship between stock and interest rate markets | 10-year breakeven | Approx. 2.33% | Decline | Rise to 5% is driven by real interest rates | Average remaining maturity of investment-grade corporate bonds | 10.3 years | Peak 12.4 years | Duration is 8.8 -> approx. 6.5 | McClellan Summation | Negative territory | First time since “Liberation Day” | Many individual stocks are lagging the index | Equal-weighted/Market-cap weighted ratio | 1.121 | May low is the lowest since 2003 | Concentration is extremely high for over the past 20 years | DB Aggregate Stock Positioning | +0.13σ (48%ile) | — | Almost neutral | AAII Net Bull | -1.3 | Negative territory despite rising stock prices | Tom Lee expects a sharp rebound | Years with >10% rise from Jan-Aug | Rose at year-end in 25 out of 28 times | Accuracy approx. 89% | Average for Sep-Dec is 5.3% | S&P 500 Forward P/E | 19x | Start of year 22x | Spread between earnings yield and real 10-year bond is unchanged at 270bp | HF software stock allocation | 5% | Feb low 1.3%, start of year 7% | 13th percentile over the past 5 years | Citi US Economic Surprise Index | 34.2 | Previous week 27.0 | Highest level since end of July | August total wage index | +0.67% MoM | July +0.19% | +4.34% YoY, highest since January | German 10-year bond | 3.45% | -7bp | Largest drop since May | ECB rate hike pricing | Oct 12.5bp / 35bp by year-end | End of next year 81bp | All shrinking | CDU (Mecklenburg state election) | 4.9% | Failed to reach 5% threshold | AfD is the largest party with 38.2% | Leveraged fund yen position | Turned to positive territory | First time since July 2025 | Had expanded to nearly -150,000 contracts at one point | SBG dollar-denominated bonds maturing in 2031 | Yield hit 8.2% | Jan 6.7% | Aiming to issue over $11 billion in junk bonds
Points to Note
First, the main drivers of the stock market rise are concentrated in two themes: oil and AI. While the Nasdaq hit a record high, energy stocks fell, and transportation and utility stocks only saw slight declines. Optimism is concentrated in technology stocks.
Second, interest rates have flattened. Long-term interest rates fell, but the 2-year bond yield rose slightly, indicating that while the market accepts lower oil prices as a sign of receding inflation, it is also aware of continued tightening regarding the short-term policy rate path.
Third, three Fed officials have all suggested additional tightening. President Musalem described the current policy rate as “still on the accommodative side,” and the swap market is pricing in three rate hikes by the end of July next year. There is a tense relationship between the market’s assumption of interest rate stability and the reality.
Fourth, even though benchmark oil prices have fallen, the tightness in petroleum products has not been resolved. Retail diesel prices have hit a new record high of over $6.50, and the IEA expects the supply-demand deficit to expand to 1.7 million barrels per day even as demand drops significantly.
Fifth, we should be cautious about the divergence between internal market indicators and the indices. The McClellan Summation Index has fallen into negative territory for the first time since “Liberation Day,” and the ratio of equal-weighted to market-cap-weighted indices continues to decline.
Sixth, sentiment and positioning do not actually indicate overheating. DB’s aggregate positioning is at the 48th percentile, which is neutral, and the AAII Net Bull is at -1.3. Bearishness while stock prices are rising is also a basis for the view that this is not the ceiling.
Seventh, German politics are in a stage of structural fragmentation. The CDU failed to reach the 5% required to win seats in the state election, and disapproval of Chancellor Merz exceeds 80%. Although not yet reflected in market prices, the risk of reform stagnation is a medium-term flashpoint.
Terminology Notes
AI Agent An AI mechanism that autonomously plans and executes multiple tasks in response to user instructions. Because the inference processing load is high, it is expected to boost demand for computing resources such as server CPUs.
McClellan Summation Index A technical indicator calculated by accumulating the difference between the number of daily advancing and declining stocks. A fall into negative territory indicates that many individual stocks are lagging behind the index as a whole.
Breakeven Inflation Rate The future average inflation rate expected by the market, calculated from the yield difference between nominal government bonds and inflation-indexed bonds. If nominal yields rise while this falls, it is considered to be primarily driven by a rise in real interest rates.
5% Threshold A mechanism in the German electoral system where, in principle, no seats are allocated to political parties that receive less than 5% of the vote. In this instance, the CDU fell below this threshold and lost its seats in the state parliament.
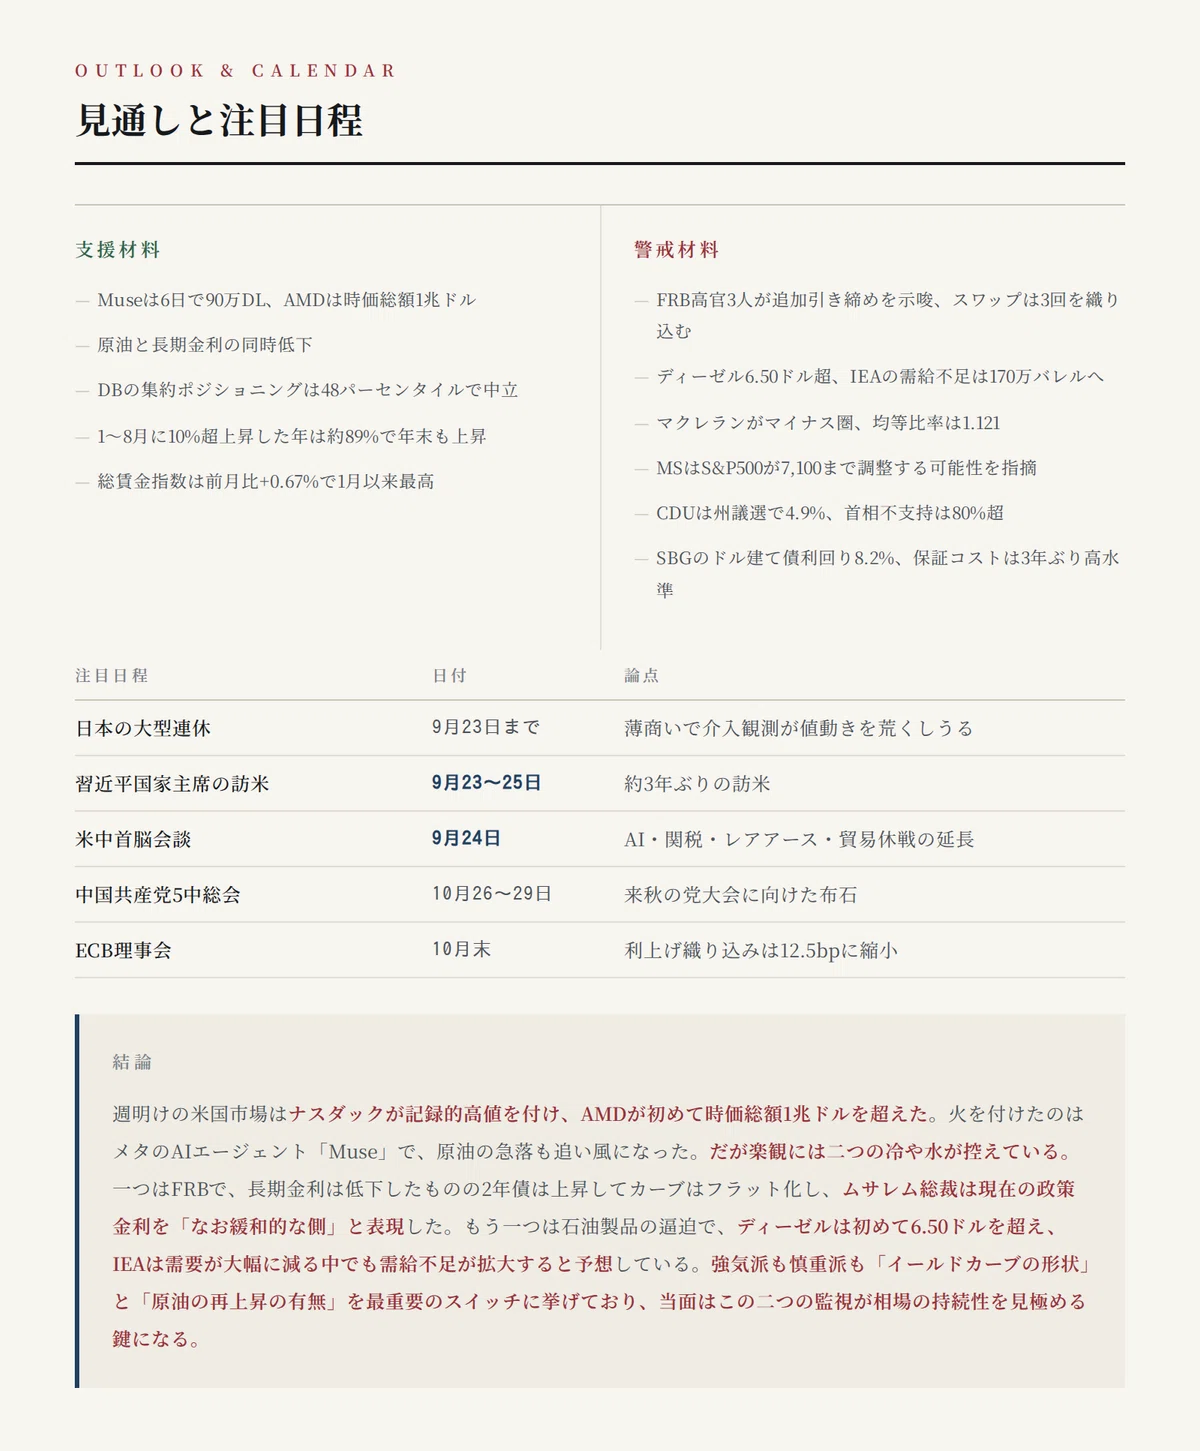
Outlook and Key Dates
Category | Content | Value/Date | Supporting Factor | AI agent adoption expectations | Muse 900k DLs in 6 days, AMD $1 trillion market cap | Supporting Factor | Simultaneous decline in oil and long-term interest rates | Brent near $100, 10-year bond around 4.95% | Supporting Factor | Neutrality of positioning | DB aggregate indicator is 48th percentile | Supporting Factor | Seasonality | Years with >10% rise from Jan-Aug rose at year-end in approx. 89% of cases | Supporting Factor | Resilience of income | Total wage index +0.67% MoM, highest since January | Cautionary Factor | Hawkish remarks by Fed officials | Swaps pricing in 3 rate hikes by end of July next year | Cautionary Factor | Tightness of petroleum products | Diesel over $6.50, IEA supply-demand deficit to 1.7 million barrels | Cautionary Factor | Weakness in market internals | McClellan in negative territory, equal-weight ratio is 1.121 | Cautionary Factor | Cautious scenario | MS points to possibility of S&P 500 adjusting to 7,100 | Cautionary Factor | German politics | CDU 4.9% in state election, chancellor disapproval over 80% | Cautionary Factor | Borrowing dependence of AI investment | SBG dollar bond yield 8.2%, insurance costs at 3-year high | Schedule | Japan’s long holiday | Until September 23. Thin trading may make intervention speculation volatile | Schedule | President Xi Jinping’s visit to the US | September 23-25. First time in about 3 years | Schedule | US-China summit | September 24. AI, tariffs, rare earths, extension of trade truce | Schedule | 5th Plenary Session of the 20th CPC Central Committee | October 26-29 | Schedule | ECB Governing Council | End of October. Rate hike pricing shrunk to 12.5bp
Conclusion
At the start of the week in the U.S. market, the Nasdaq Composite hit a record high, and AMD exceeded a market capitalization of $1 trillion for the first time. The spark was Meta’s new AI agent, “Muse,” which recorded over 900,000 downloads in the six days since its release.Driven by the view that the spread of agent-based AI will boost demand for server CPUs, Arm surged around 17%, Intel around 12%, and Qualcomm over 9%, leading the semiconductor stock index to rise for the fifth consecutive trading day.
The sharp drop in crude oil also acted as a tailwind. Brent crude fell to around $100 per barrel, marking its longest losing streak of four trading days since June. Selling was fueled by satellite data showing Saudi crude shipments were “surprisingly strong,” as well as President Trump indicating he would not rule out a meeting with the Iranian president.
However, two buckets of cold water await this optimism.
The first is the Fed. Although long-term interest rates fell, the 2-year Treasury yield rose slightly, causing the curve to flatten.St. Louis Fed President Musalem described the current policy rate as “still on the accommodative side,” and Chicago Fed President Goolsbee and Minneapolis Fed President Kashkari both hinted at the possibility of further tightening. The swap market is pricing in three more rate hikes by the end of next July.A tension remains between the “interest rate stability” assumed by the stock market and the “continued tightening” indicated by the interest rate market.
The second is the tightness in petroleum products. Even though benchmark crude oil prices have fallen, U.S. retail diesel prices exceeded $6.50 for the first time, hitting a record high. While the IEA expects this year’s oil demand to see its largest decline since COVID, at 2.5 million barrels per day, it predicts that the supply-demand deficit will actually widen to 1.7 million barrels per day. Demand is falling, yet inventories are shrinking at a record pace—the fragility of the supply structure itself remains unresolved.
The internal market is sending cautious signals. The McClellan Summation Index has fallen into negative territory for the first time since “Liberation Day,” and the ratio of equal-weighted to market-cap-weighted indices remains at 1.121, indicating continued concentration in large-cap stocks.However, positions are near neutral, and individual investors are clearly bearish. As Tom Lee points out, investors are not bearish at the top—how one evaluates this rule of thumb will determine their future outlook.
President Xi Jinping’s visit to the U.S. from the 23rd to the 25th, and the U.S.-China summit on the 24th. An AI dialogue framework was agreed upon, but an extension of the trade truce remains unresolved.Since both bulls and bears cite the “shape of the yield curve” and “whether or not oil prices rise again” as the most important switches, continuing to monitor these two factors for the time being is the most reliable way to gauge the sustainability of the market.
Disclaimer
This article is for informational purposes only and does not recommend the buying or selling of any specific financial product. It does not constitute investment advice or brokerage services, and you should make investment decisions at your own risk. While the content is based on sources deemed reliable, we do not guarantee its accuracy or completeness. Investing in financial products carries the risk of principal loss due to price fluctuations, interest rate changes, and currency fluctuations. The author assumes no responsibility for any damages incurred based on the information in this article.