
")
Ulrike Schmitt-Hartmann
Editor’s Note: This article was first published to paying subscribers on August 1.
Yesterday’s EIA monthly US oil production reporting is not getting enough attention amidst the bloodbath price action we saw across the board today. While the headline for US oil production showed a minor drop from 13.239 million b/d to 13.178 million b/d, what people didn’t know was that using the production + adjustment method, US implied oil production actually fell from 13.45 million b/d down to 12.974 million b/d.
From February to May, the average US oil production (EIA 914 + monthly adjustment) is 13.312 million b/d.
In Q4 2022, using the same methodology, US oil production averaged 13.183 million b/d.
In essence, US oil production has grown by 129k b/d since Q4 2022. If that’s not a stalling growth picture, then I don’t know what is.
HFIR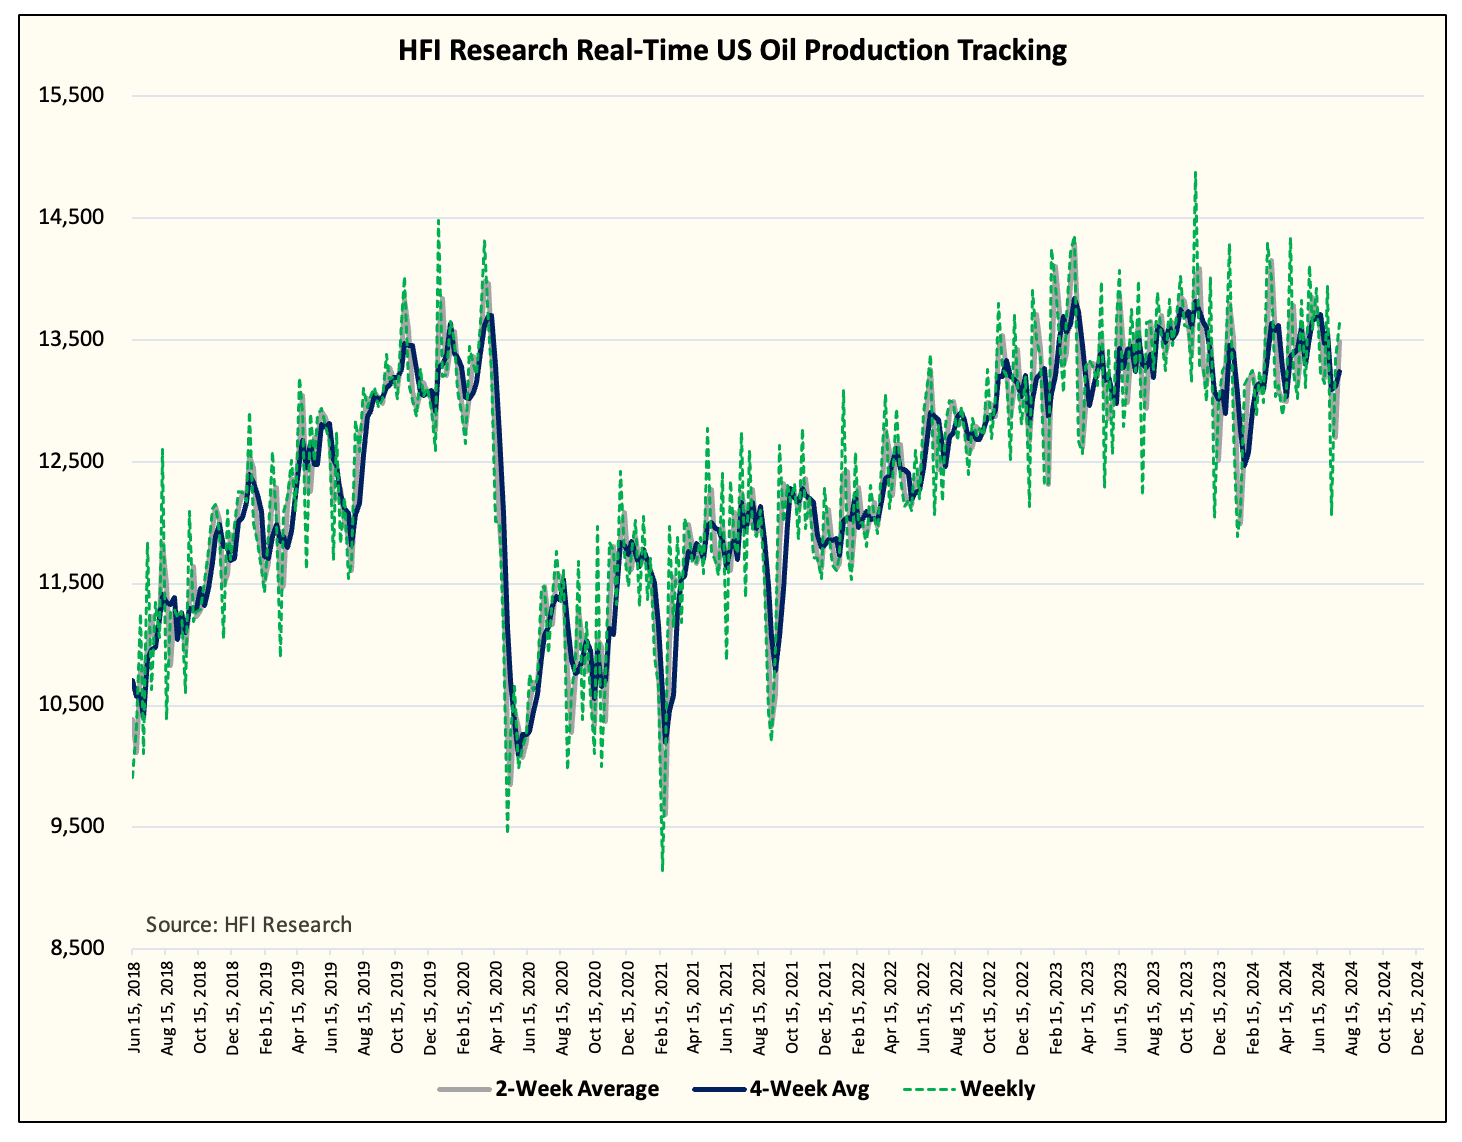
This has also been clearly illustrated in our real-time US oil production chart. Based on the latest data, US oil production is back down to ~13.1 million b/d. This means that since Q4 2022, we’ve had no real material growth out of US shale.
Why this matters…
One of our key variant perceptions coming into 2024 was that people overestimated the production growth we saw from shale in 2023. The main culprit for this is from EIA’s production reporting change. Following the June 2023 introduction of “transfers to crude oil supply,” EIA purposely increased US oil production in an attempt to eliminate the dreaded “adjustment” figure. The reality is that US oil production was meaningfully higher at the end of 2022 (please see our real-time graph for the spike into the end of 2022).
So while headline growth showed +1 million b/d, the reality was closer to +250k b/d to +300k b/d. This, in turn, resulted in overly optimistic US shale oil production growth assumptions into the end of 2024 and 2025.
As a result, most oil analysts are overstating non-OPEC supply figures in 2025, which is pushing them toward the bearish side.
Reality…
The reality is much simpler than you think. US shale oil production is closer to the end than the beginning. Tier 1 wells are being depleted and while operators are still getting more efficient over time, the efficiency gains will not be able to offset the rock quality. At the end of the day, you can’t out-engineer your reservoir, and with well results showing lower overall productivity y-o-y, US shale is climbing an ever faster treadmill of natural decline.
EIA, HFIR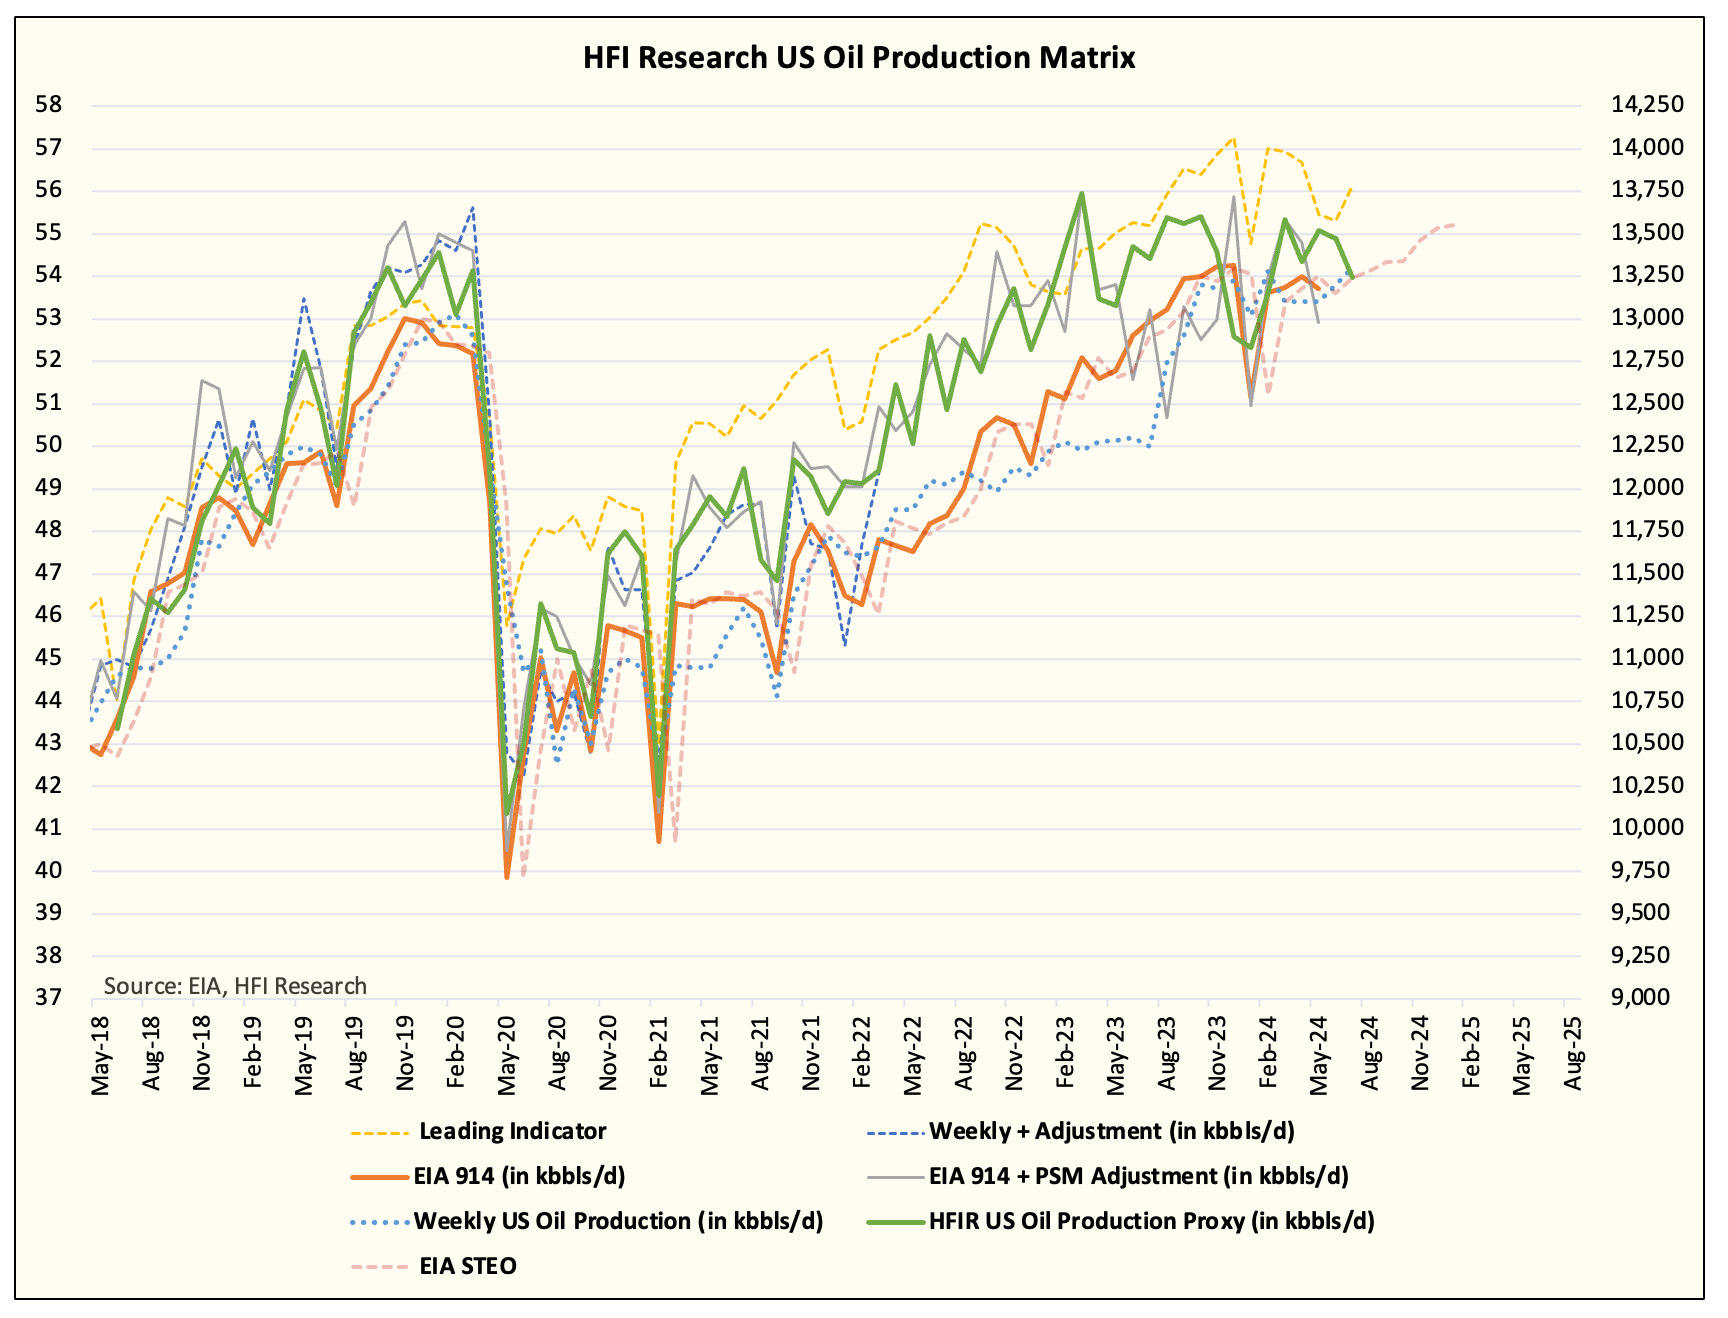
This is why we have been pounding the table on the divergence we are seeing in associated gas production and crude production. Typically, you don’t see associated gas production materially outpacing crude production unless the basin is towards the mature stage.
Now if you account for the fact that Waha basin differentials have been nothing but punitive, then you quickly realize that higher associated gas production is not the result of gas-directed drilling, by just the nature of a declining reservoir.
There are caveats to this “maturing” shale phase discussion, however. Exxon (XOM) and Chevron (CVX) appear hellbent on boosting US shale production, and with the type of capital oil majors can spend, they will likely achieve their growth through scale and synergies. Nonetheless, while 20% of the Permian grows as much as they can, the other 80% will experience the treadmill decline. In aggregate, we will still see some production growth from US shale into year-end. Our estimate is for an exit of around ~13.45 million b/d, and a possible increase to ~13.6 million b/d by the end of 2025. But that’s all the growth there’s left.
Most of this production growth is coming from Exxon and Chevron. There will be others like Diamondback (FANG) and Occidental (OXY) that will be able to show some modest growth (~2%), but that’s about it. Everyone else will be lucky to keep overall production flat.
Watch the narrative flip…
Like we wrote in our OMF yesterday, the narrative follows the price. In the case of the oil market outlook, price will first react, before people buy into the thesis that US shale oil production is slowing. It’s never the other way around no matter how much we pound the table. It is what it is.
But the narrative will flip and reality will set in. The growth engine of non-OPEC supplies is coming to an end.