

Bitcoin (BTC) price pushed to $74,425 on 16 March, marking its strongest level since early February as a shift in the Middle East conflict improved risk appetite across markets. The move came after Iran’s new supreme leader, Mojtaba Khamenei, confirmed the Strait of Hormuz would remain open to all nations except the United States and Israel, partially easing a blockade that had disrupted roughly 20% of global seaborne oil for over two weeks.
The announcement followed US military strikes on Kharg Island on Friday, the hub responsible for the vast majority of Iran’s oil exports, though oil infrastructure was not directly targeted. Markets appear to have read the combination of partial de-escalation on shipping and continued military pressure as a step toward containment rather than further escalation.
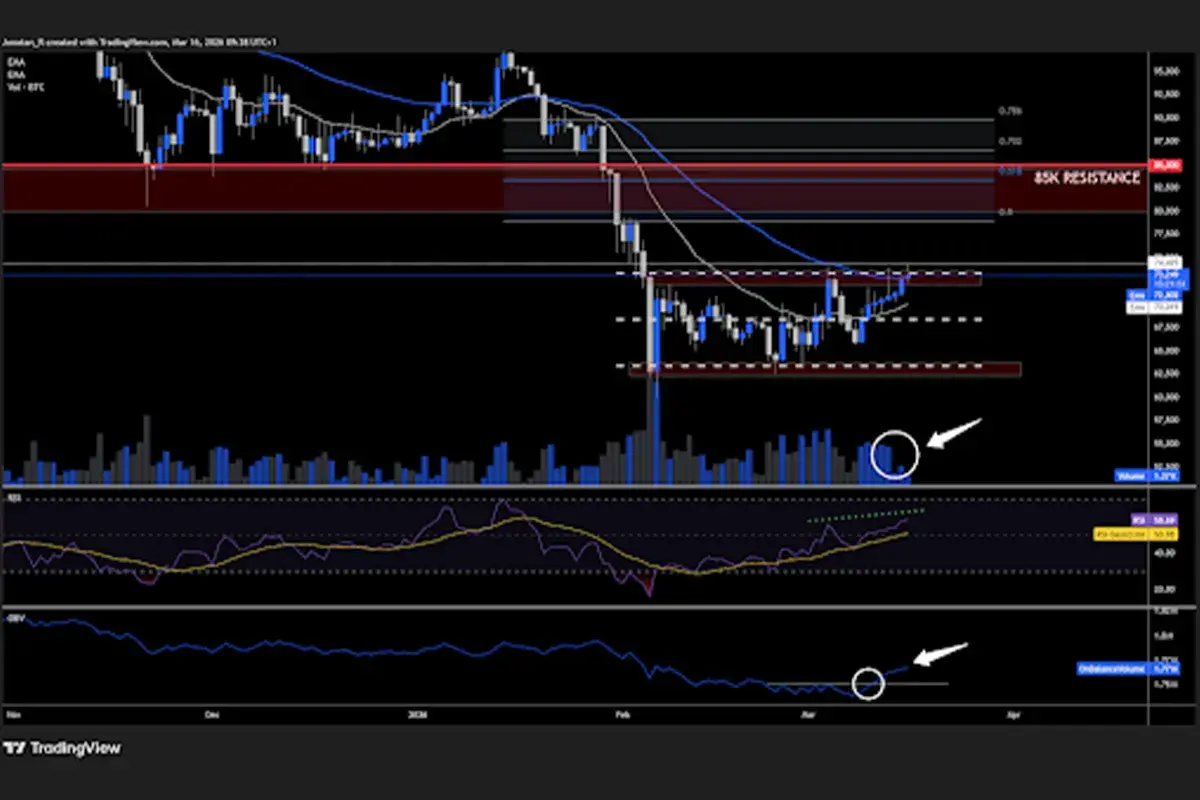
Daily chart analysis
On the daily timeframe, BTC has pushed to a high of $74,425, a level not seen since 4 February. Two technical indicators are supporting the move.
The RSI has not yet reached overbought territory despite the rally, and continues to make higher highs in line with price. This is a healthy signal that suggests momentum is building rather than exhausting itself. In contrast, previous rally attempts in February saw the RSI diverge from price before pullbacks followed.
More significantly, the On Balance Volume (OBV) is breaking out for the first time since Bitcoin fell below $80,000 at the start of the year. OBV measures cumulative buying and selling pressure, and a breakout in this indicator points to genuine accumulation and growing participation behind the move. This is a notable shift from the bearish OBV divergence that had been in place throughout February and early March, where price made higher highs while OBV printed lower highs.
It is worth noting that at the time of writing, the daily candle is still in its early hours, meaning the full volume picture will only become clear by the close. If OBV confirms the breakout on a closing basis, it would add significant conviction to the bullish case on this timeframe.
Key levels: $74,425 is the immediate resistance. $72,000 is the nearest support below.
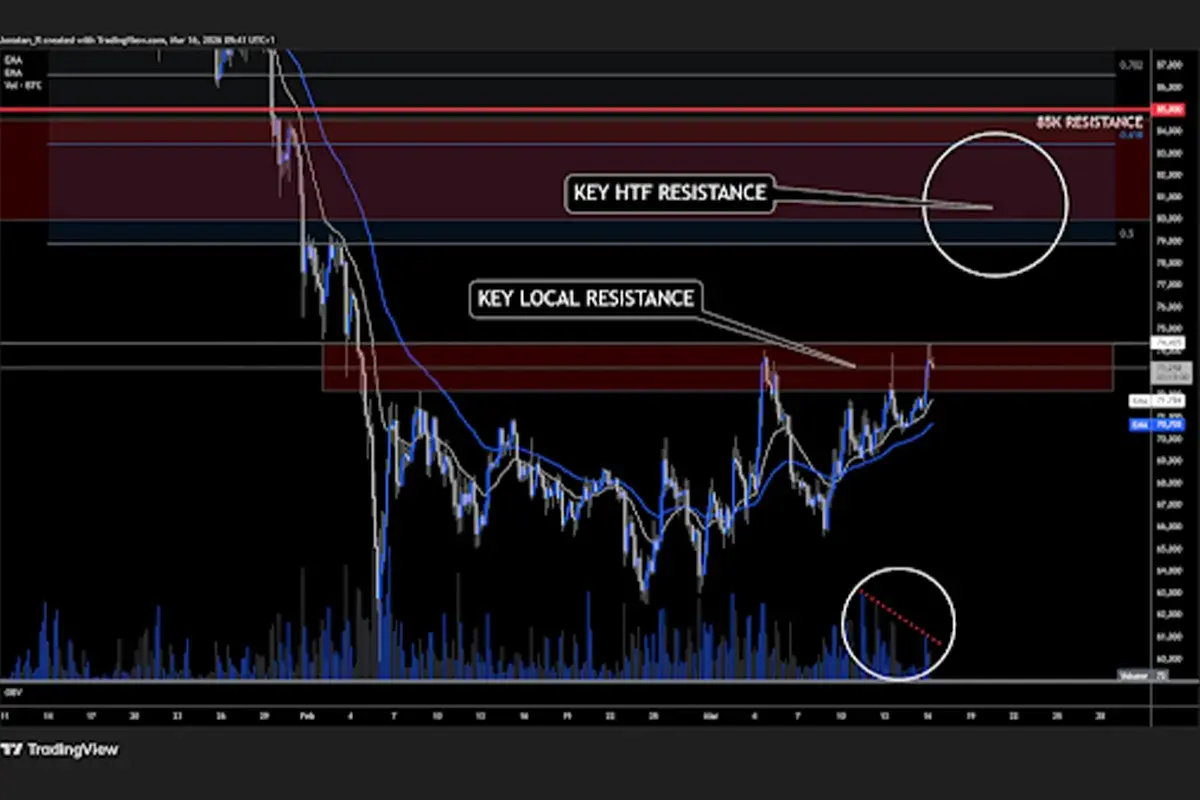
4-hour chart analysis
Zooming into the 4-hour timeframe, the local trend has been constructive with price steadily pushing higher since the late February lows. Each successive pullback has found support at higher levels, building a staircase pattern of higher lows that reflects sustained buying interest on dips.
However, the volume behind this move warrants caution. Each successive push higher on the 4-hour chart has been accompanied by declining volume, a pattern that typically suggests the move is losing participation even as price grinds higher. This creates a divergence between price structure, which looks bullish, and volume structure, which is not confirming with the same level of conviction.
This does not necessarily mean the move will fail, but it suggests traders should watch for either a volume expansion to validate the breakout or a rejection that could lead to a retest of the $72,000 support area. A sharp increase in volume on the next leg higher would resolve the divergence positively and support continuation toward resistance. Conversely, a breakdown below $72,000 on rising volume would be a warning sign that the local rally is fading.
Putting it all into the context of the primary trend
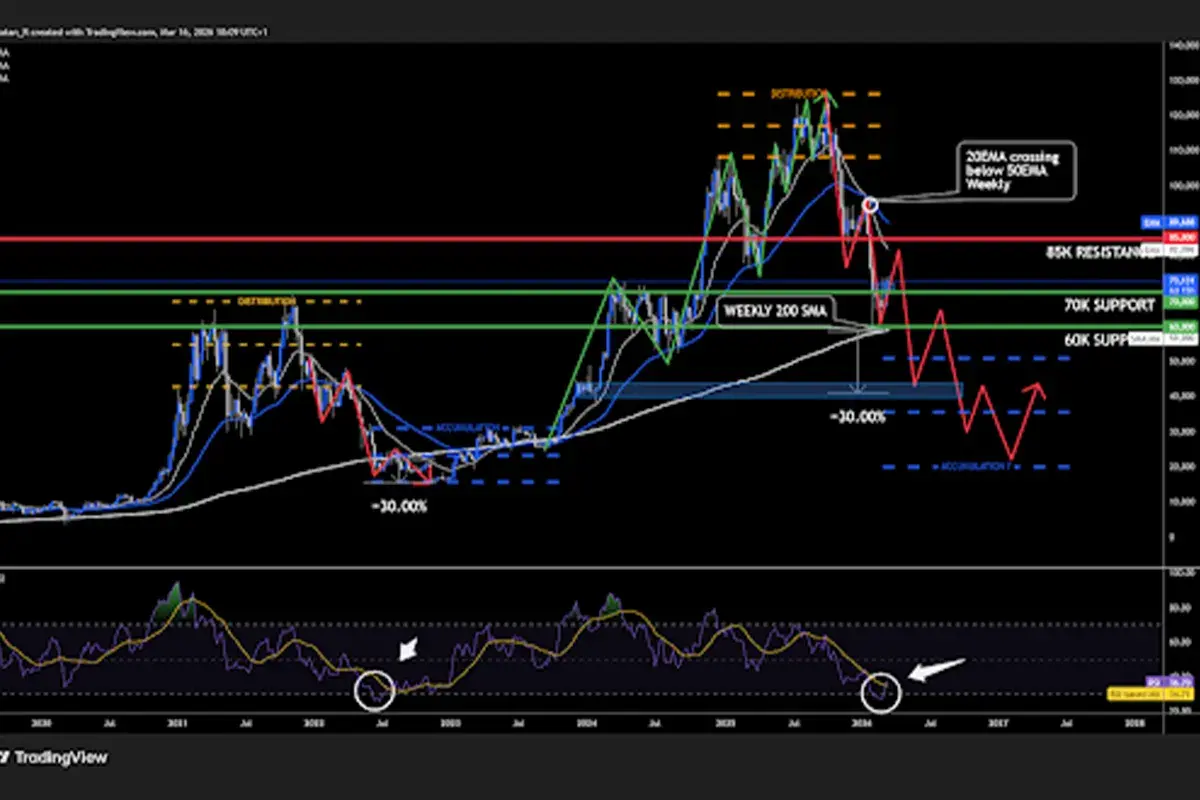
To put all of this into context, it is important to zoom out. On the weekly timeframe, Bitcoin remains firmly in a downtrend. Earlier this year, the 20 EMA crossed below the 50 EMA on the weekly chart, a bearish signal that confirms the shift in the longer-term trend. The structure of lower highs and lower lows has been in place since the all-time high of $126,272 in October 2025, and nothing in the current price action has changed that.
The $60,000 support area lines up with the weekly 200 SMA around $59,000, and it is worth remembering that in previous Bitcoin bear markets, price has broken below the 200 SMA before finding a true bottom. This level held during the initial Iran sell-off in late February, but it should not be treated as an unbreakable floor.
The $85,000 zone remains the key resistance overhead. This area aligns with the 0.618 to 0.786 Fibonacci retracement of the latest impulse move lower, along with major price action resistance and the weekly EMAs. A push into this zone would still represent a retest of the downtrend from below, not a reversal.
At the bottom of the chart, the weekly RSI has dropped to levels that have been seen very rarely in Bitcoin’s history. While many traders read deeply oversold RSI readings as a signal that a bottom may be near, it is important to remember that in past bear markets Bitcoin has declined 30% or more after the weekly RSI first entered oversold territory. Oversold does not mean the selling is over.
Looking at this chart through the lens of a bear market, and applying Dow Theory to the current structure, the timing suggests we could potentially be around halfway through this cycle’s downturn. If the pattern of previous bear markets holds, accumulation for Bitcoin could begin later this year, but potentially at levels well below where price is currently trading.
For now, the short-term picture is constructive with the daily OBV breakout being a genuinely positive signal. But the weekly chart makes it clear that any rally from here is happening within the context of a larger downtrend, and traders should be sizing and managing risk accordingly.
Trading Bitcoin volatility with PrimeXBT
Periods of geopolitical uncertainty often trigger sharp volatility across both traditional and digital asset markets. For traders navigating these conditions, access to flexible trading infrastructure and advanced analytical tools can play an important role in how opportunities and risks are managed.
PrimeXBT, a global multi-asset broker, provides access to crypto derivatives and futures trading through its PXTrader 2.0 platform, which integrates TradingView-powered charts with more than 100 indicators, helping traders analyse market structure and key levels.
The platform also offers customisable leverage of up to 1:1000, with both cross and isolated margin modes available, alongside advanced order types including market, limit, and stop orders, as well as one-click trading for faster execution.
For crypto futures traders specifically, PXTrader 2.0 provides a real order book with deep liquidity and competitive fees, as well as both hedge and netting modes, allowing traders greater flexibility in managing positions during periods of heightened market volatility.
Beyond Bitcoin, PrimeXBT provides access to more than 480 markets from a single account, including Forex, commodities, indices, shares, crypto CFDs, and crypto futures, with some of the most competitive trading conditions. Through crypto-funded accounts, traders can deploy digital assets as trading capital to access these global markets without converting to fiat.
Start trading with PrimeXBT.
About PrimeXBT
PrimeXBT is a global multi-asset broker and crypto asset service provider trusted by traders in more than 150 countries. The platform bridges traditional and digital markets within one integrated environment, redefining versatility and innovation in online trading. Clients can access Forex, CFDs on indices, commodities, shares, crypto, and Crypto Futures, as well as buy, store and exchange cryptocurrencies directly. This unified experience extends across both the native PXTrader 2.0 platform and MetaTrader 5, supported by advanced risk-management tools and a wide range of funding options in crypto, fiat and local payment methods. Since 2018, PrimeXBT has focused on empowering traders through broad multi-asset access, fair and transparent conditions, professional-grade technology and dedicated human support. By combining expertise, trust and a client-first approach, PrimeXBT sets a benchmark of excellence in the financial industry and provides traders with the tools they need to trade, grow and succeed with confidence.
Disclaimer: The content provided here is for informational purposes only and is not intended as personal investment advice and does not constitute a solicitation or invitation to engage in any financial transactions, investments, or related activities. Past performance is not a reliable indicator of future results. The financial products offered by the Company are complex and come with a high risk of losing money rapidly due to leverage. These products may not be suitable for all investors. Before engaging, you should consider whether you understand how these leveraged products work and whether you can afford the high risk of losing your money. The Company does not accept clients from the Restricted Jurisdictions as indicated on its website / T&Cs. Some products and services, including MT5, may not be available in your jurisdiction. The applicable legal entity and its respective products and services depend on the client’s country of residence and the entity with which the client has established a contractual relationship during registration.