

Bitcoin price remains under pressure as gold strength reshapes cross-asset behavior. The breakout of gold has been accompanied by a decline in the price of Bitcoin, which confirms their inverse correlation.
Meanwhile, BTC price reacts to defensive capital rotation into traditional safe havens. This change is indicative of constrained liquidity conditions in the world. Notably, the price movement in Bitcoin remains in line with macro-based flows and not single catalysts..
Gold’s Breakout Reinforces Risk-Off Capital Rotation
Bitcoin price is indirectly pressured as gold continues its upward trend. In particular, gold has risen to more than $4,325, which reflects seven-week highs. This breakout validates the revived demand of capital preservation.
Meanwhile, the inverse relationship between gold and BTC price has re-emerged clearly. Notably, capital rotation into gold often coincides with reduced exposure to speculative assets. This trend is now seen to be consistent once again.
Additionally, higher real yields support gold inflows while draining excess liquidity. As a result, the price of Bitcoin responds adversely to such redistribution. In addition, gold strength is more of a macro warning than a demand.
This environment restricts aggressive BTC price recovery attempts. Hence, the break out of gold is an indication of continued defensive positioning. Bitcoin price is susceptible to macro-based mechanisms as long as gold is high.
Inverse relationship between Gold vs Bitcoin shows ONE thing… 🥶 https://t.co/xQq8E2IMDc pic.twitter.com/M4nGMxX6i1
— Crypto Banter (@crypto_banter) December 15, 2025
Bitcoin Price Structure Indicates Downside Risk Pre-Recovery
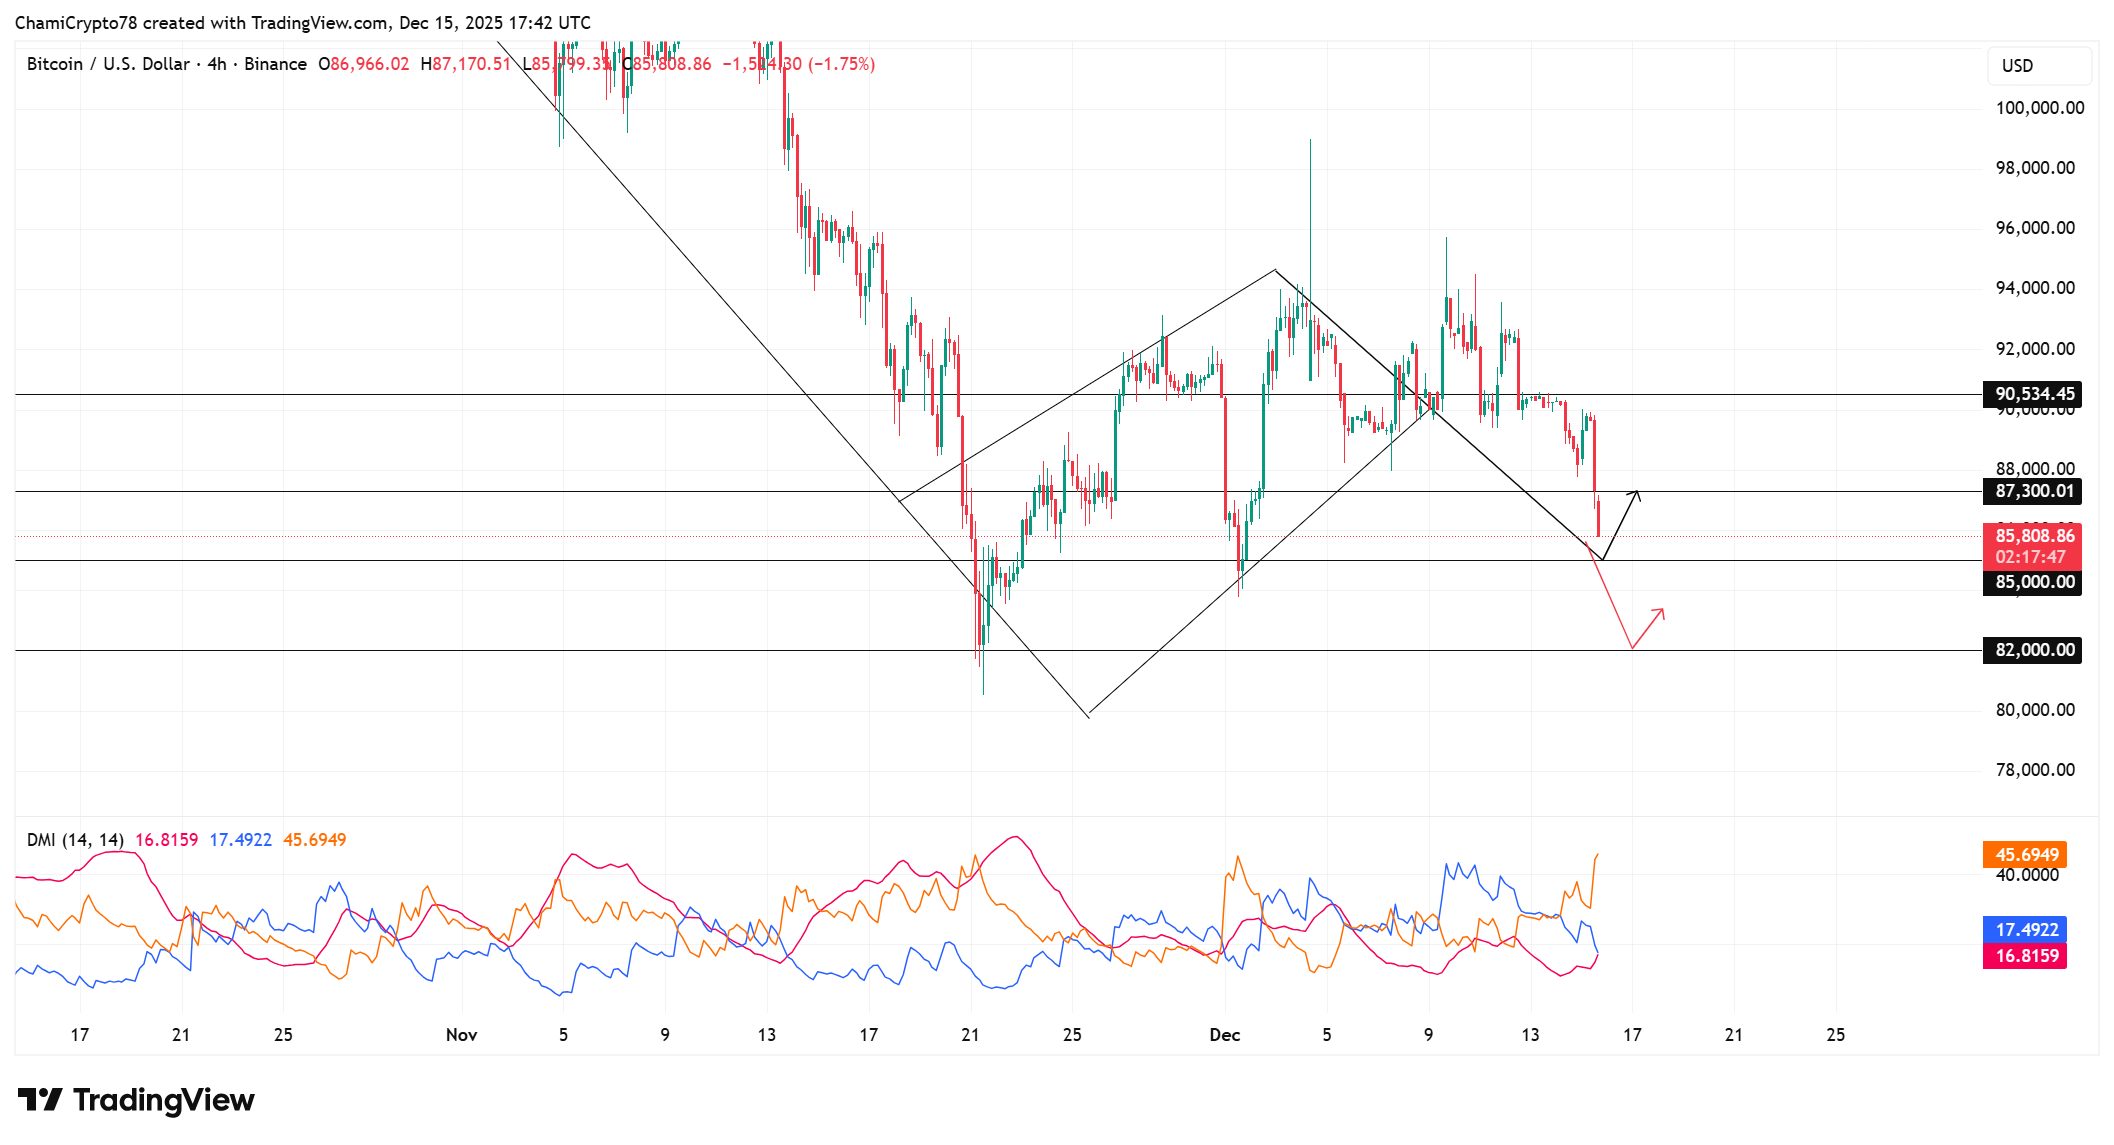
BTC price structure demonstrates increasing technical weakness. At the time of writing, BTC market value stands at approximately $85,800 after being rejected several times at around the $90,500 area. Initially, BTC price formed a bearish pennant after a sharp decline.
This structure is a sign of consolidation under selling pressure. It is worth noting that the pennant breakdown affirmed continuation risk. After that, the price action was unable to regain previous support at around $87,300, which has now become resistance.
Meanwhile, DMI readings reinforce bearish conditions. In particular, -DI is close to 45, whereas +DI is close to 17. This broad distance demonstrates that sellers have directional control. In the case where -DI prevails at high levels, downside pressure persists rather than stabilizes.
ADX around 16 indicates that there is no exhaustion in the trend and the selling pressure has space to run. The combination of these readings suggests that there is a long-term bias to the downside, and not a short-term pullback.
Additionally, successive lower highs confirm structural weakness. Therefore, BTC price continues to gravitate toward the $85,000 level.
Besides, if the $85,000 level fails to hold, $82,000 emerges as a secondary downside zone for recovery. Consequently, the future BTC price outlook remains constrained until structural stabilization occurs.
Long vs Short Liquidations Highlight Downside Pressure Zones
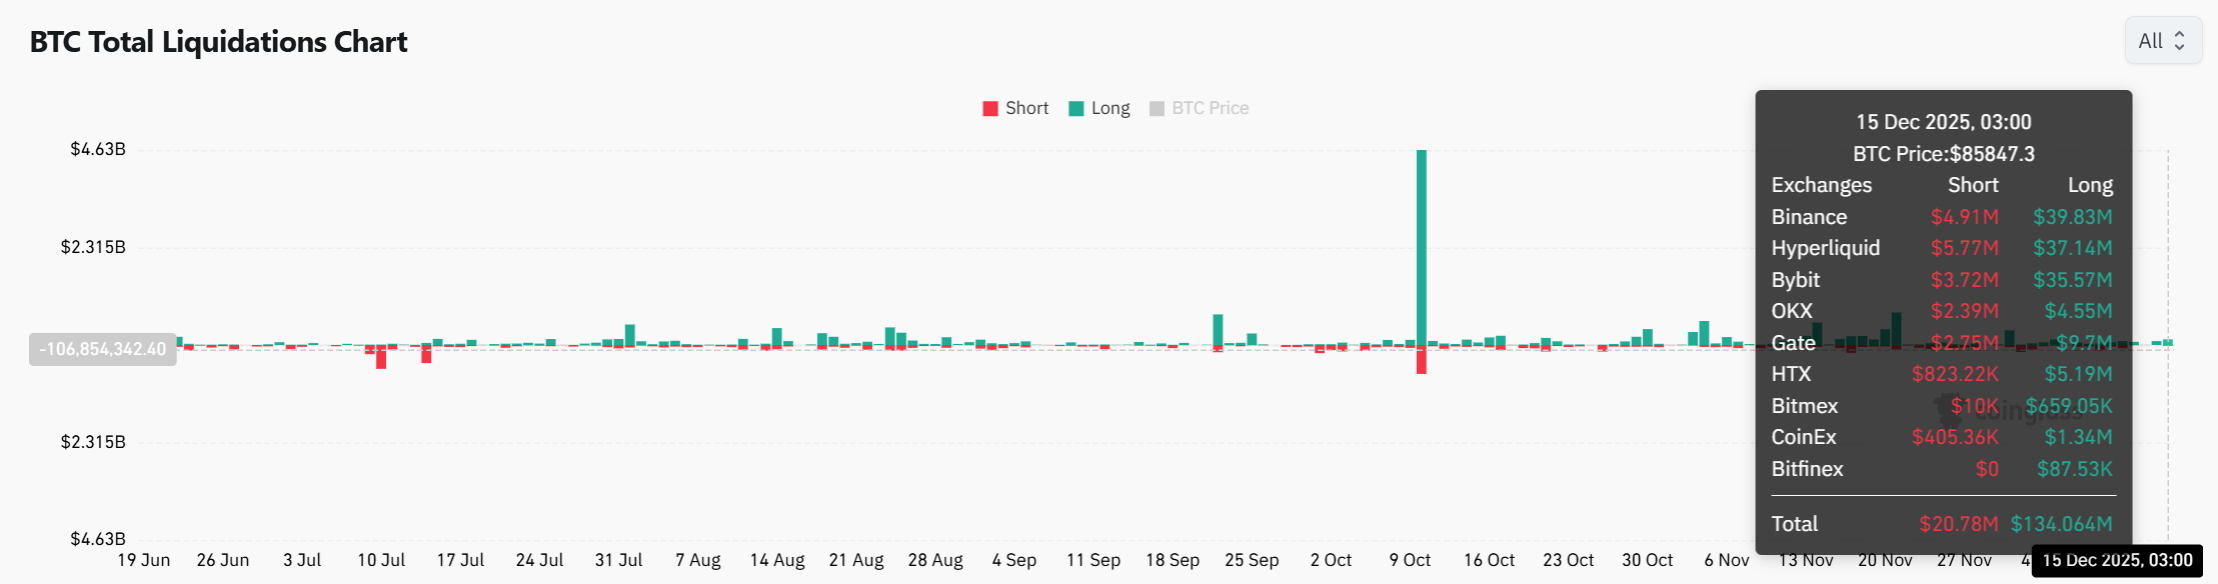
Bitcoin price dynamics also reflect liquidation behavior. According to CoinGlass analytics, long liquidations exceeding $134 million across major exchanges. In contrast, short liquidations remained near $21 million. This asymmetry emphasizes forced exits of long positioning.
Notably, these liquidations occurred near $85,800. The region has become a liquidity concentration area. In the meantime, the lower price range of under $85,000 is not very tested. This design enhances the downside attraction to that level.
Additionally, expectations surrounding Japan’s rate hike have reduced global dollar liquidity. Historically, such shifts have pressured risk assets, including Bitcoin. Therefore, downside pressure caused by liquidation is consistent with macro tightening, as opposed to positioning resets.
To sum up, the Bitcoin price is still vulnerable to the downside pressure as it is nearing the $85,000 mark. Gold’s sustained breakout confirms defensive capital rotation, limiting near-term recovery potential.
The structure of Bitcoin price indicates ongoing weakness in the areas of major resistance. The liquidation information supports the idea of $85,000 as the main area of downside emphasis. Therefore, recovery remains unlikely until Bitcoin price stabilizes and holds firmly above the $85,000 zone.