

Major market indexes are still shaky, as uncertainty around oil prices and the war in the Middle East continues to rattle the global economy. Now more than ever, it’s crucial to invest in strong stocks and funds that can withstand volatility.
The Vanguard S&P 500 ETF (VOO +0.59%) and the Vanguard Total Stock Market ETF (VTI +0.52%) are incredibly popular and powerful funds. While they can both be strong choices for a wide variety of portfolios, here’s how each might stand up to a potential recession or market crash.

Image source: Getty Images.
Key differences that could impact your bottom line
The S&P 500 ETF and Total Stock Market ETF are similar in many ways. They’re both broad-market funds that encompass a wide variety of stocks across all industries, offering impressive diversification that’s tough to beat.
However, while the S&P 500 ETF holds only around 500 large-cap stocks, the Total Stock Market ETF includes over 3,500 stocks from small-cap to large-cap. This leads to a few important distinctions:
- Difference in diversification: With around seven times as many holdings, the Total Stock Market ETF has the edge in terms of pure diversification. Generally speaking, a wider variety of stocks can help reduce the risk that a single stock or industry will significantly affect performance.
- Large-cap stability: While the S&P 500 ETF is narrower, larger companies tend to be more stable than their smaller counterparts. Small- and mid-cap stocks can be shakier during periods of economic instability, and the S&P 500 ETF excludes these investments entirely.
- Heavy tilt toward tech: Tech giants make up a significant portion of the S&P 500, giving this ETF a slightly stronger tech tilt — though the difference is subtle. Both ETFs have the same top 10 holdings, but the technology sector makes up 33% of the S&P 500 ETF’s portfolio compared to 31% for the Total Stock Market ETF.
So what does all this mean? Each fund carries unique advantages and drawbacks, creating a different set of risks.
The S&P 500 ETF offers greater stability with its large-cap focus, but because it’s slightly more tech-heavy, it could experience larger drawdowns if the tech industry is hit hard. The Total Stock Market ETF offers maximum diversification, but that also means investing in many smaller companies that could be more vulnerable to volatility.
What history says about risk
Throughout the most recent bear market in 2022, the ETFs experienced similar levels of volatility — with the S&P 500 dipping by around 18% and the Total Stock Market ETF falling by roughly 19%.
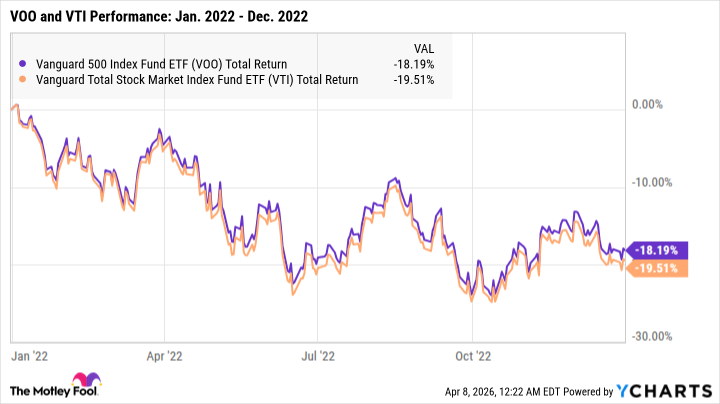
VOO Total Return Level data by YCharts
The Vanguard S&P 500 ETF was launched in 2010, so there’s no historical data on its performance throughout the Great Recession. However, because it tracks the S&P 500 and aims to mirror its returns, it’s safe to assume its performance would have been closely aligned with the index’s.
Between late 2007 and 2009, the Total Stock Market ETF experienced a drawdown almost identical to that of the S&P 500. In terms of risk, then, the two ETFs offer very similar profiles, based on historical data.
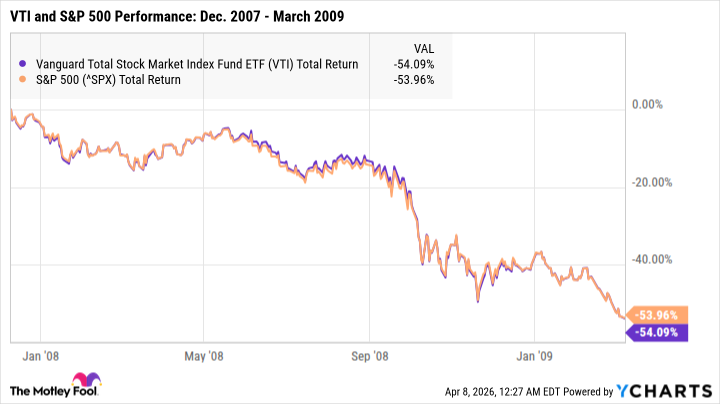
VTI Total Return Level data by YCharts
In terms of performance, the funds are also fairly similar. While the S&P 500 ETF has edged ahead of the Total Stock Market ETF — one advantage of the fund’s heavier tech focus — their 10-year total returns are roughly in line.
If you’d invested $1,000 in each of these funds a decade ago, you’d have around $3,800 in total with the S&P 500 ETF versus just under $3,700 with the Total Stock Market ETF.
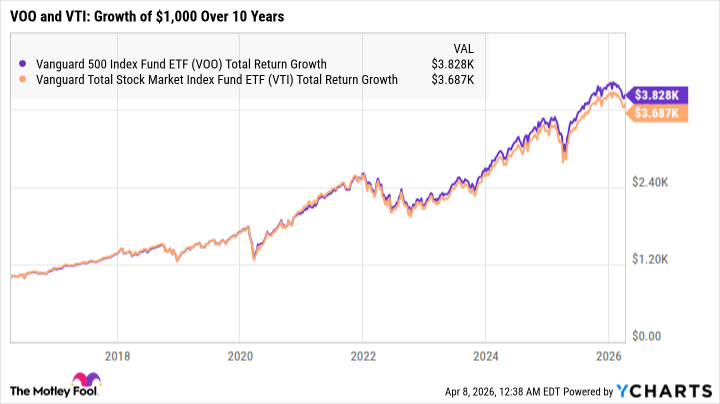
VOO Total Return Level data by YCharts
Which is the better buy?
Both funds are well positioned to withstand volatility, with strong long-term track records of weathering recessions and bear markets.
If the tech industry continues to thrive over time, the S&P 500’s slightly stronger emphasis on this sector could result in marginally higher returns. For investors who are nervous about tech stocks right now, though, the Total Stock Market ETF’s broader diversification could help ease some of those concerns.
Neither ETF is necessarily better than the other, and they’re both strong choices. The right one for your portfolio will probably come down to subtle differences in individual preferences.