

Stock Market Outlook Key Takeaways
- The US stock market is trading at a 10% discount to a composite of our valuations
- Individual stock selection is increasingly important, as only seven mega-cap stocks account for most of the undervaluation
- Tightening monetary policy, rising interest rates, and high inflation are increasingly challenging for the equity market
Based on a composite of our intrinsic valuations of the stocks we cover included in the Morningstar US Market Index, as of Sept. 30, 2026, the US equity market was trading at approximately a 10% discount to our fair value estimates.
Yet while the broad market appears to be trading at an attractive margin of safety below our valuations, we think the US stock market is entering an especially risky environment. Where we see undervaluation is extremely concentrated, momentum has reversed course, and macrodynamics are turning negative.
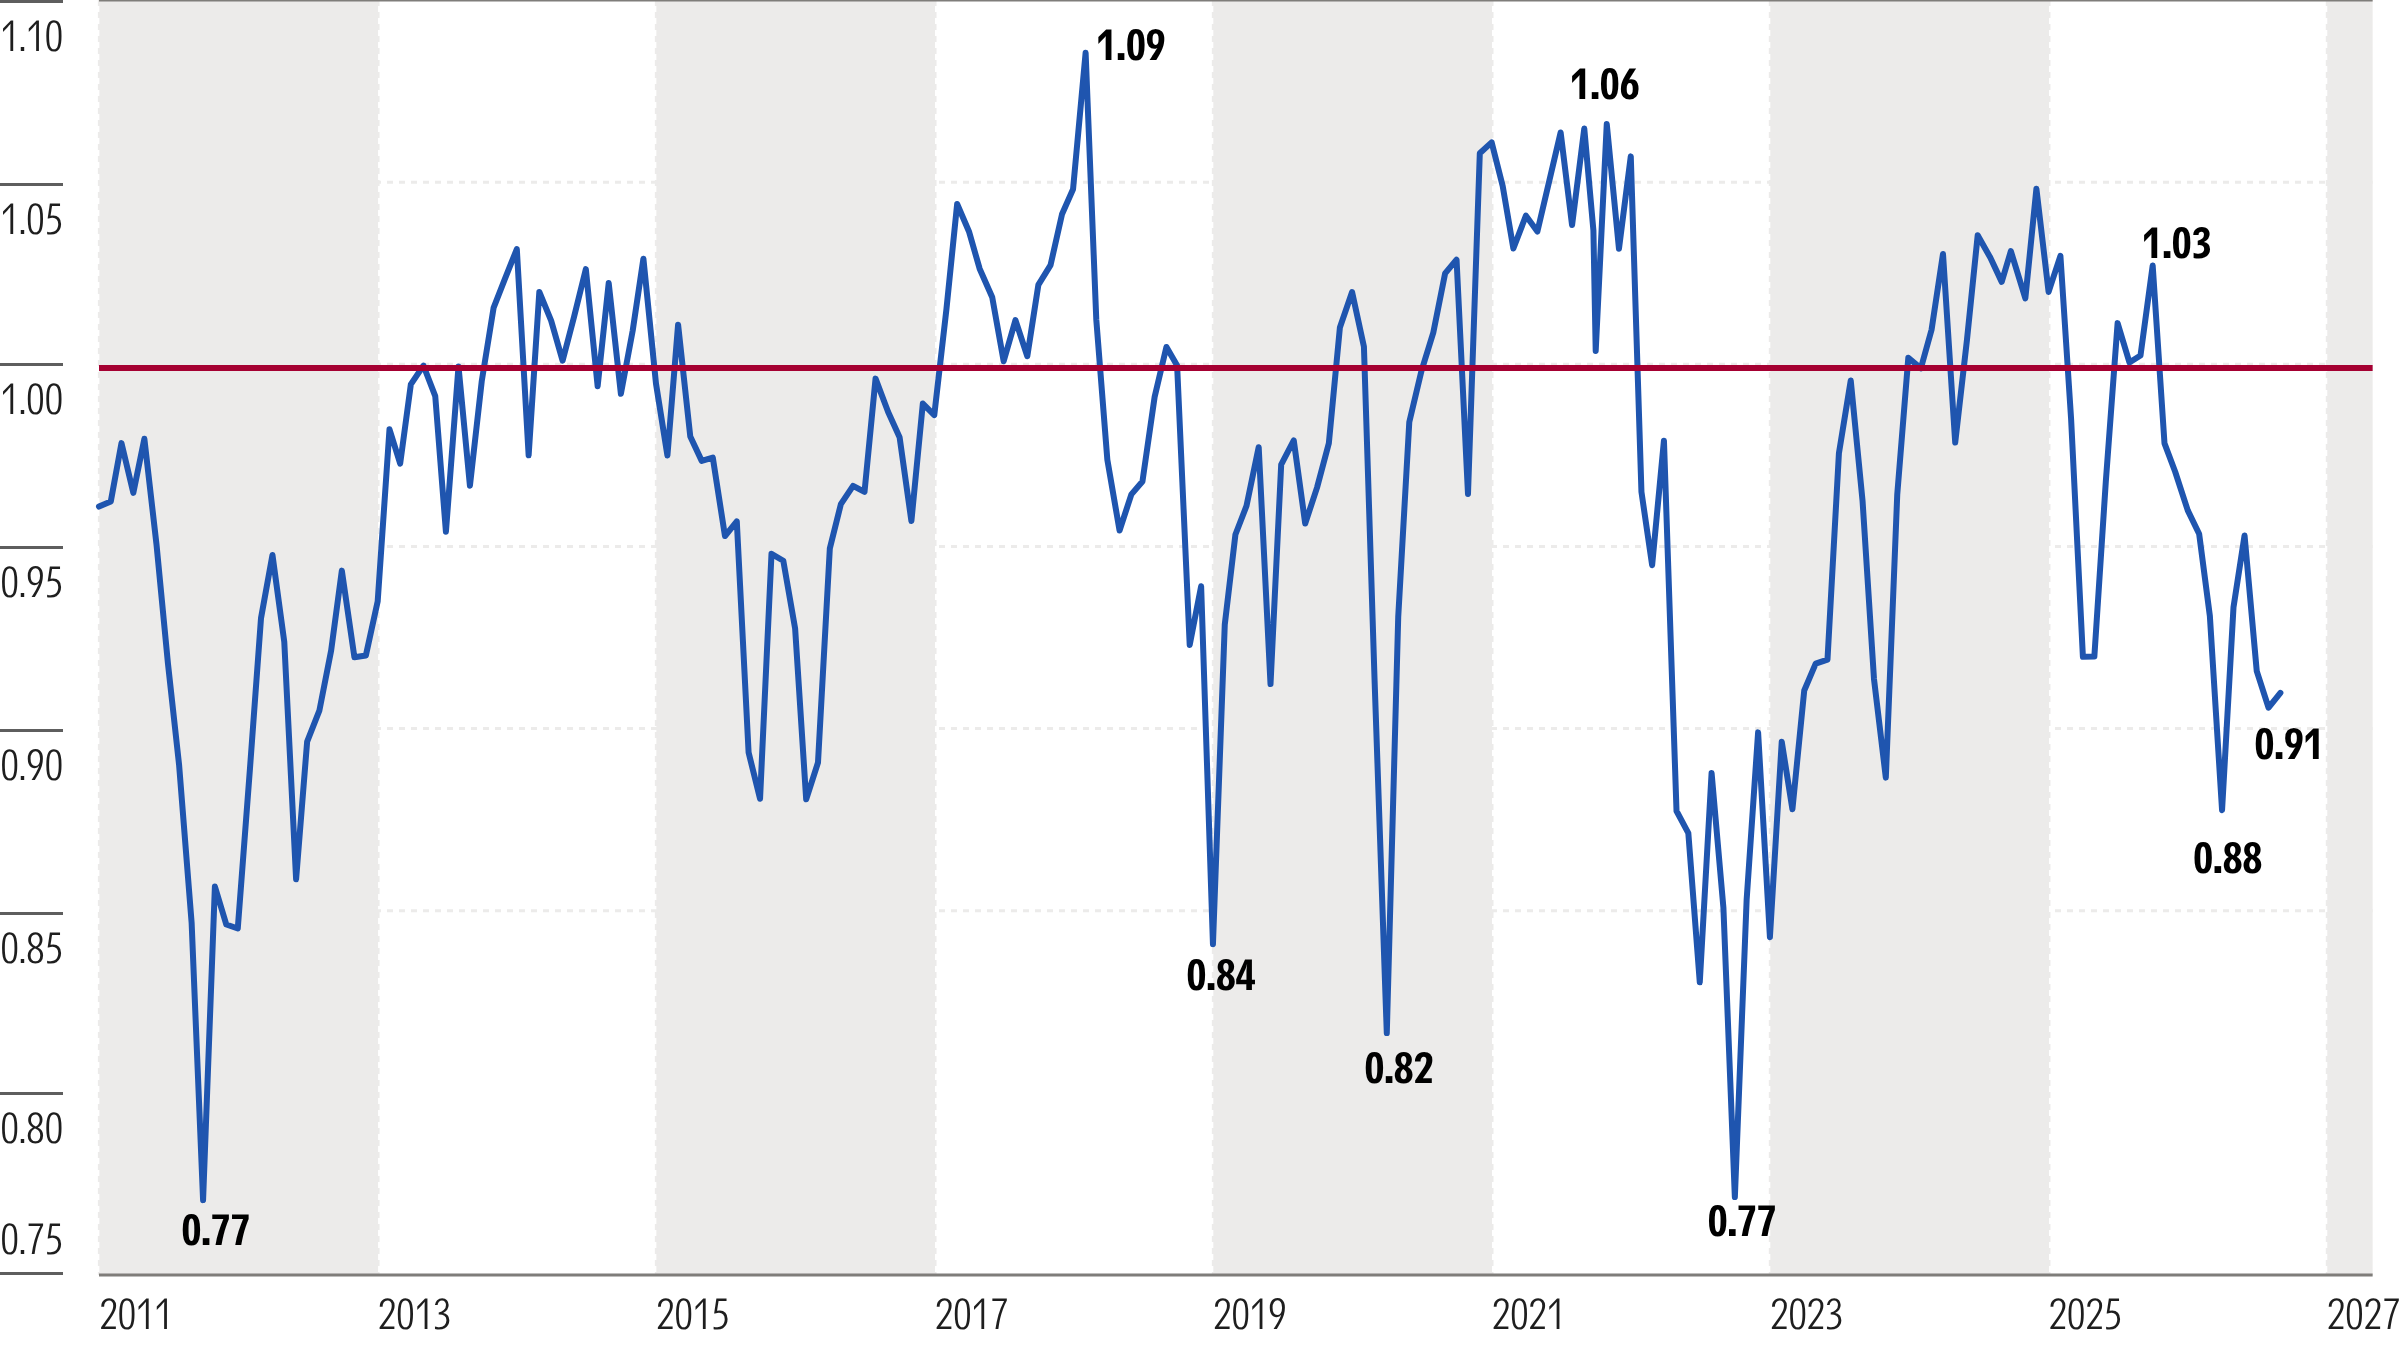
Undervaluation Is Concentrated in Only 7 Stocks
The combined amount that just seven mega-cap stocks (Nvidia, Alphabet, Broadcom, Microsoft, Meta Platforms, Amazon.com, and Tesla, aka the Undervalued Seven) are undervalued accounts for the entire amount that the market is undervalued. Excluding these seven from our valuation composite, our remaining coverage would indicate the Morningstar US Market Index is trading at fair value. The investment thesis for each of these stocks depends heavily on our expectations for continued artificial intelligence infrastructure spending and the long-term economic value ultimately created by AI.
While current market levels indicate the market is pricing in strong near-term growth through 2027 and 2028, according to our equity analyst valuations, we believe investors do not fully recognize the extent of the earnings and cash flow growth these companies may generate over the subsequent three to five years.
Market Breadth Extremely Poor, as AI Leaders Drag Indexes to New Highs
Stock market indexes are hitting new highs, but only because mega-cap AI technology leaders continue to power higher and have dragged the indexes along with them as a substantial number of the remaining stocks in the index struggle. Breadth is particularly bad, as the number of stocks trading below 200-day moving averages and the number of stocks hitting their lows is increasing.
Ugly Macrodynamics
On the macrodynamic front, several headwinds have been building that usually cause us to turn cautious.
- Long-term interest rates have been rising in both the US and internationally, hitting levels not seen in decades.
- The Fed tightened monetary policy, with another hike to the federal-funds rate expected by year-end.
- Inflation will likely remain elevated as oil prices continue to climb higher.
- US economic growth is heavily reliant on high capital expenditure on the AI buildout boom and its related economic multiplier effect.
- International economies such as Europe are relatively stagnant, and the Chinese economy may be weaker than reported.
- Last, the potential for systematic risk from rising interest rates on Japanese government bonds and a weakening yen continues to increase.
Positioning for the Remainder of 2026 and Heading Into 2027
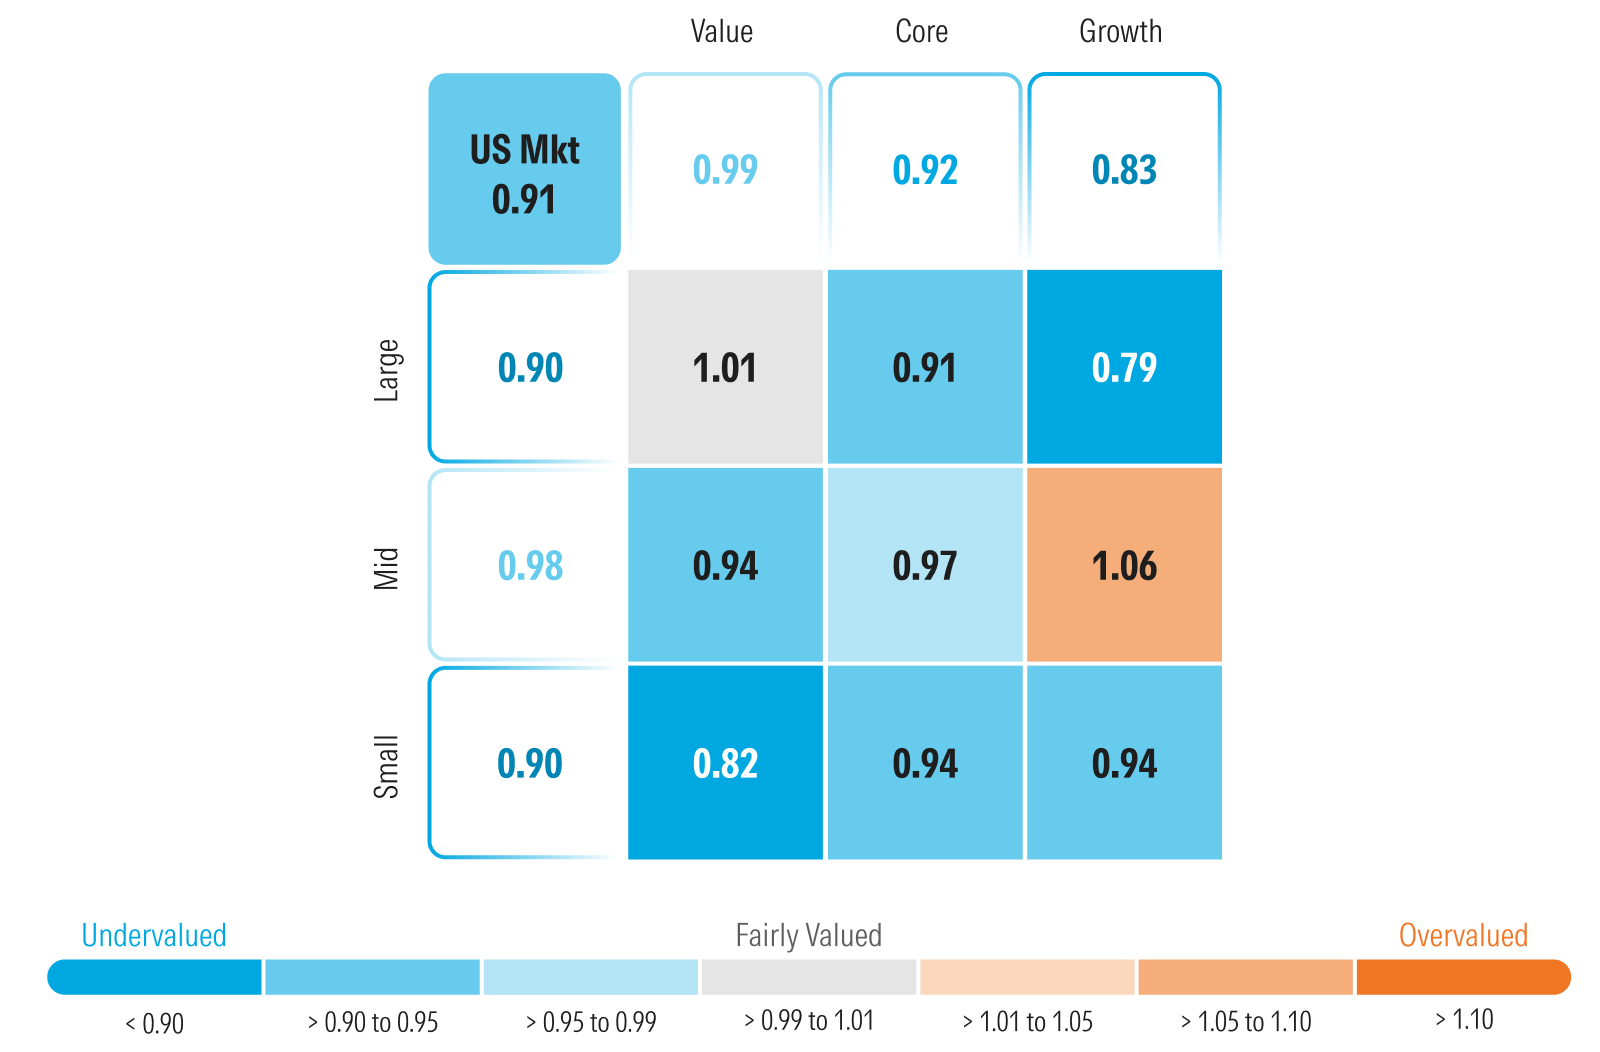
At the beginning of the third quarter, we recommended investors move to an equal weight across style, as no one Morningstar Category was trading at much more of a discount than any other.
Since then, the Morningstar US Value Market Index rose 2.04%. The gains in the value category were driven by significant gains across the healthcare and energy sectors. The Morningstar US Core Market Index declined 0.78%, as the number of stocks that declined within the core category was more than enough to offset otherwise healthy gains in Microsoft, Apple, Meta, and Amazon. The Morningstar US Growth Market Index dropped 4.24%, with the preponderance of the loss stemming from semiconductor manufacturing equipment manufacturers and several commodity-oriented technology hardware providers.
After incorporating stock price movements and changes to our fair values, current valuations point us back toward a barbell-shaped portfolio, slightly overweighting growth and value and underweighting core. Yet with the preponderance of undervalued opportunities tied to only seven stocks, it has increasingly become a stock-picker’s market. Within the growth category, we would look to overweight those specific undervalued stocks that account for the preponderance of undervaluation and steer clear of long-duration, non-AI growth stocks at risk of selling off if rates continue to rise. Excluding those stocks from our composite calculation, the growth category would otherwise be overvalued.
By capitalization, the Morningstar US Large Cap Market Index rose 3.60%, whereas the Morningstar US Mid Cap Market Index and Morningstar US Small Cap Market Index declined 1.85% and 5.60%, respectively. Based on our valuations, we advocate a slight overweighting in small caps following the selloff.
Where We See Opportunity by Sector
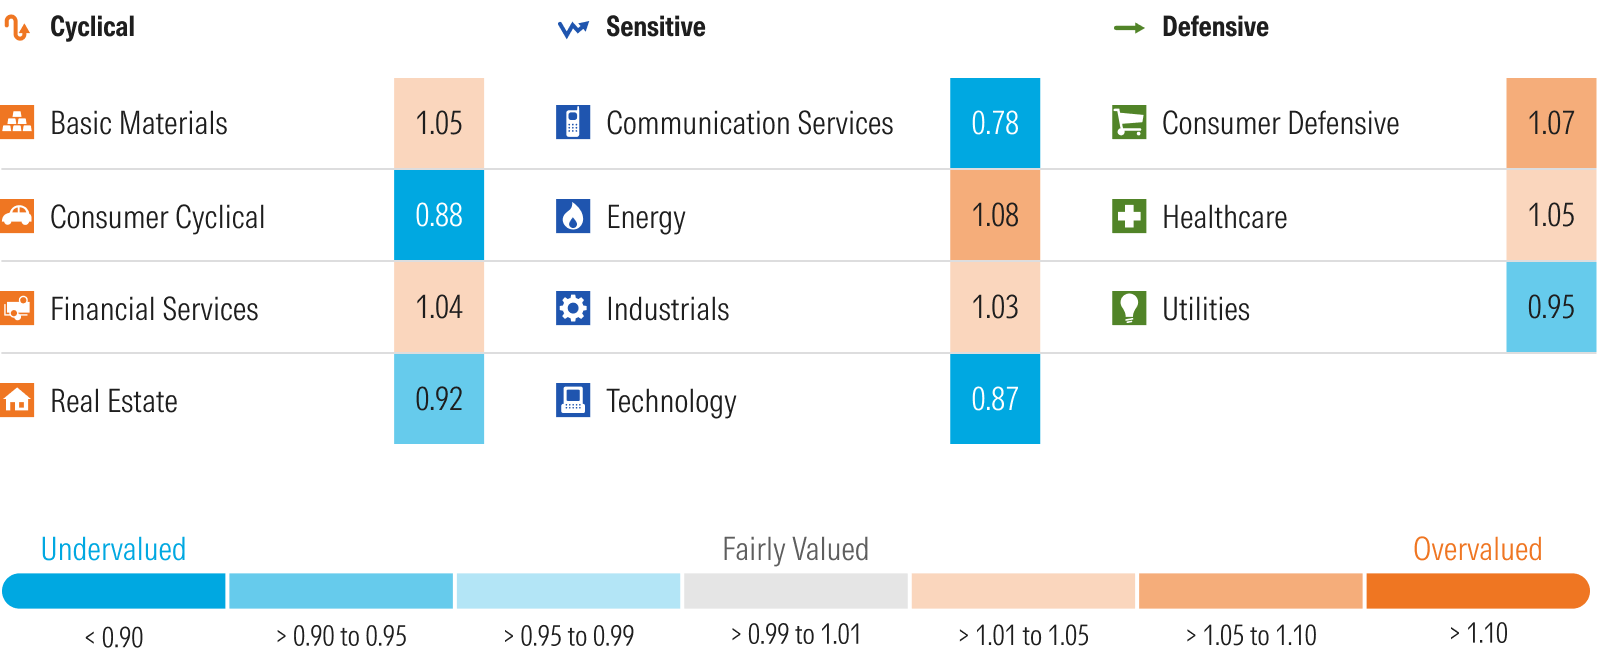
In the third quarter, there was an especially wide dispersion of returns by sector and, as a result, some very significant swings in sector valuations.
The greatest change in our sector valuations occurred in the industrials and utilities sectors. Between starting the quarter in overvalued territory and being considered a fixed-income substitute, the utilities sector performed the worst this past quarter. Similarly, the industrials sector was the most overvalued coming into the third quarter and sold off as several overvalued stocks considered to be second-derivative plays on AI retreated from their highs. Following the selloffs in these sectors, industrials is now back to fairly valued, and utilities is undervalued. Similarly, following the selloff in real estate stocks, as the sector is negatively correlated with bond prices, real estate has become further undervalued.
Energy has been especially volatile this year as oil prices have swung in relation to the on-again/off-again hostilities with Iran. Energy started the year as one of the most undervalued sectors, surged to the most overvalued by the end of March, and then back to undervalued by the end of June. This volatility has allowed investors to capture gains by adjusting their weightings in relation to the swings in valuations. Following the almost 16% surge in energy this past quarter, the sector is now fairly valued.
At a 20% discount, the communication sector remains the most undervalued. Two of the greatest differentials between our valuation and the market are Alphabet and Meta, which account for 55% and 19% of the sector market capitalization, respectively. Consumer cyclicals is the next most undervalued sector. Similarly, Amazon and Tesla account for 39% and 16% of the sector market capitalization, respectively, and both trade at deep discounts to our valuations.
The tech sector is trading at a 10% discount to fair value. However, excluding Nvidia, Broadcom, and Microsoft, the sector trades at a 5% premium.
The consumer defensive sector remains slightly overvalued, but much less so than in the past following stock price declines in overvalued Walmart and Costco, which skewed the sector well into overvalued territory.
Rounding out the remaining sectors, healthcare has risen enough to trade slightly overvalued, and basic materials and financial services are close to fairly valued.
Looking Forward: Individual Stock Selection Increasingly Important
Considering that much of the market’s undervaluation is concentrated in the Undervalued Seven, investors face an especially challenging environment for portfolio positioning. This challenge is magnified by deteriorating macrodynamic conditions. As these undervalued mega-cap stocks skew the cap-weighted valuations of their respective sectors and categories, we believe individual stock selection is more important than usual.
Looking forward, category- and sector-specific exchange-traded funds and mutual funds may not offer the same upside potential as individual stock selection, as their returns may be diluted by holdings within those portfolios that are fairly valued or overvalued. As such, investors may be better served by selectively overweighting those individual undervalued mega-caps within categories and sectors.
For investors seeking opportunities beyond the Undervalued Seven, we expect these characteristics will be especially attractive in the current environment:
- Companies with durable competitive advantages that provide pricing power. Examples include businesses benefiting from high switching costs, where it is too expensive to switch to a competing product, or intangible assets such as patents.
- Companies operating in defensive sectors, which tend to be less sensitive to economic cycles.
- Shorter-duration equities whose valuations are derived from shorter-term free cash flow rather than earnings projected far into the future, making them less vulnerable to rising interest rates.
- Companies with little or no floating-rate debt, reducing the negative impact of higher interest rates’ pressure on earnings.
- Stocks with higher dividend yields that also have a long history of consistently increasing dividends at or above the rate of inflation.
- Businesses that can benefit from inflationary environments, particularly those with revenue models tied to transaction values or pricing structures that naturally rise alongside inflation.
Conversely, investors may want to be cautious of:
- Companies without durable competitive advantages, especially those without pricing power—particularly those operating in commoditylike industries where they are price-takers rather than price-makers.
- Highly cyclical businesses whose earnings are heavily dependent on economic growth and consumer or business financing activity.
- Long-duration growth stocks that are not the technological leaders in AI, especially where valuations rely heavily on earnings and cash flows expected far into the future.
- Companies with significant floating-rate debt exposure.
- Negative free cash flow businesses, those that require additional external capital to fund operations or growth.
In our view, successful investing in the current market environment will depend less on traditional portfolio allocations and more on identifying companies that can still benefit in an environment where macrodynamic factors are becoming increasingly challenging.