

 Last week’s property market figures tell a rather different story to the mood you sometimes hear on the high street. Sellers are still coming to market in healthy numbers, sales activity remains ahead of pre-Covid levels, and there is no shortage of people who still want to move home. The market is functioning, but with considerably more choice available to buyers, the rules of the game have changed.
That extra choice means buyers can afford to be selective, and that puts far greater pressure on asking prices. The strongest evidence is what happens to the homes that actually find buyers. Around eight in ten successful sellers who have come to market this year have achieved a sale without needing to reduce their asking price. In other words, the issue is not necessarily a lack of buyers, but whether the price is compelling enough to make them act.
And that raises the question every homeowner thinking of selling should be asking. If properties are still selling in significant numbers, why do some homes disappear quickly while others sit on the market for months? The answer may have far less to do with the property market itself and more about their choice of Estate Agent
This week, Simon Gates joins me to look at Week 34 of the UK property market (week ending 30th August 2026.) in The UK Property Market Stats Show, picking apart the latest figures to see how the UK property market is really performing. Then in the second half of the video, they head to Oldham in the North West, where they analyse the Oldham stats for the last 5.5 years to discover which Oldham estate agents are actually delivering for their sellers, before turning our attention to the town’s lettings market as well.
🟩 Listings
Week 34 ..
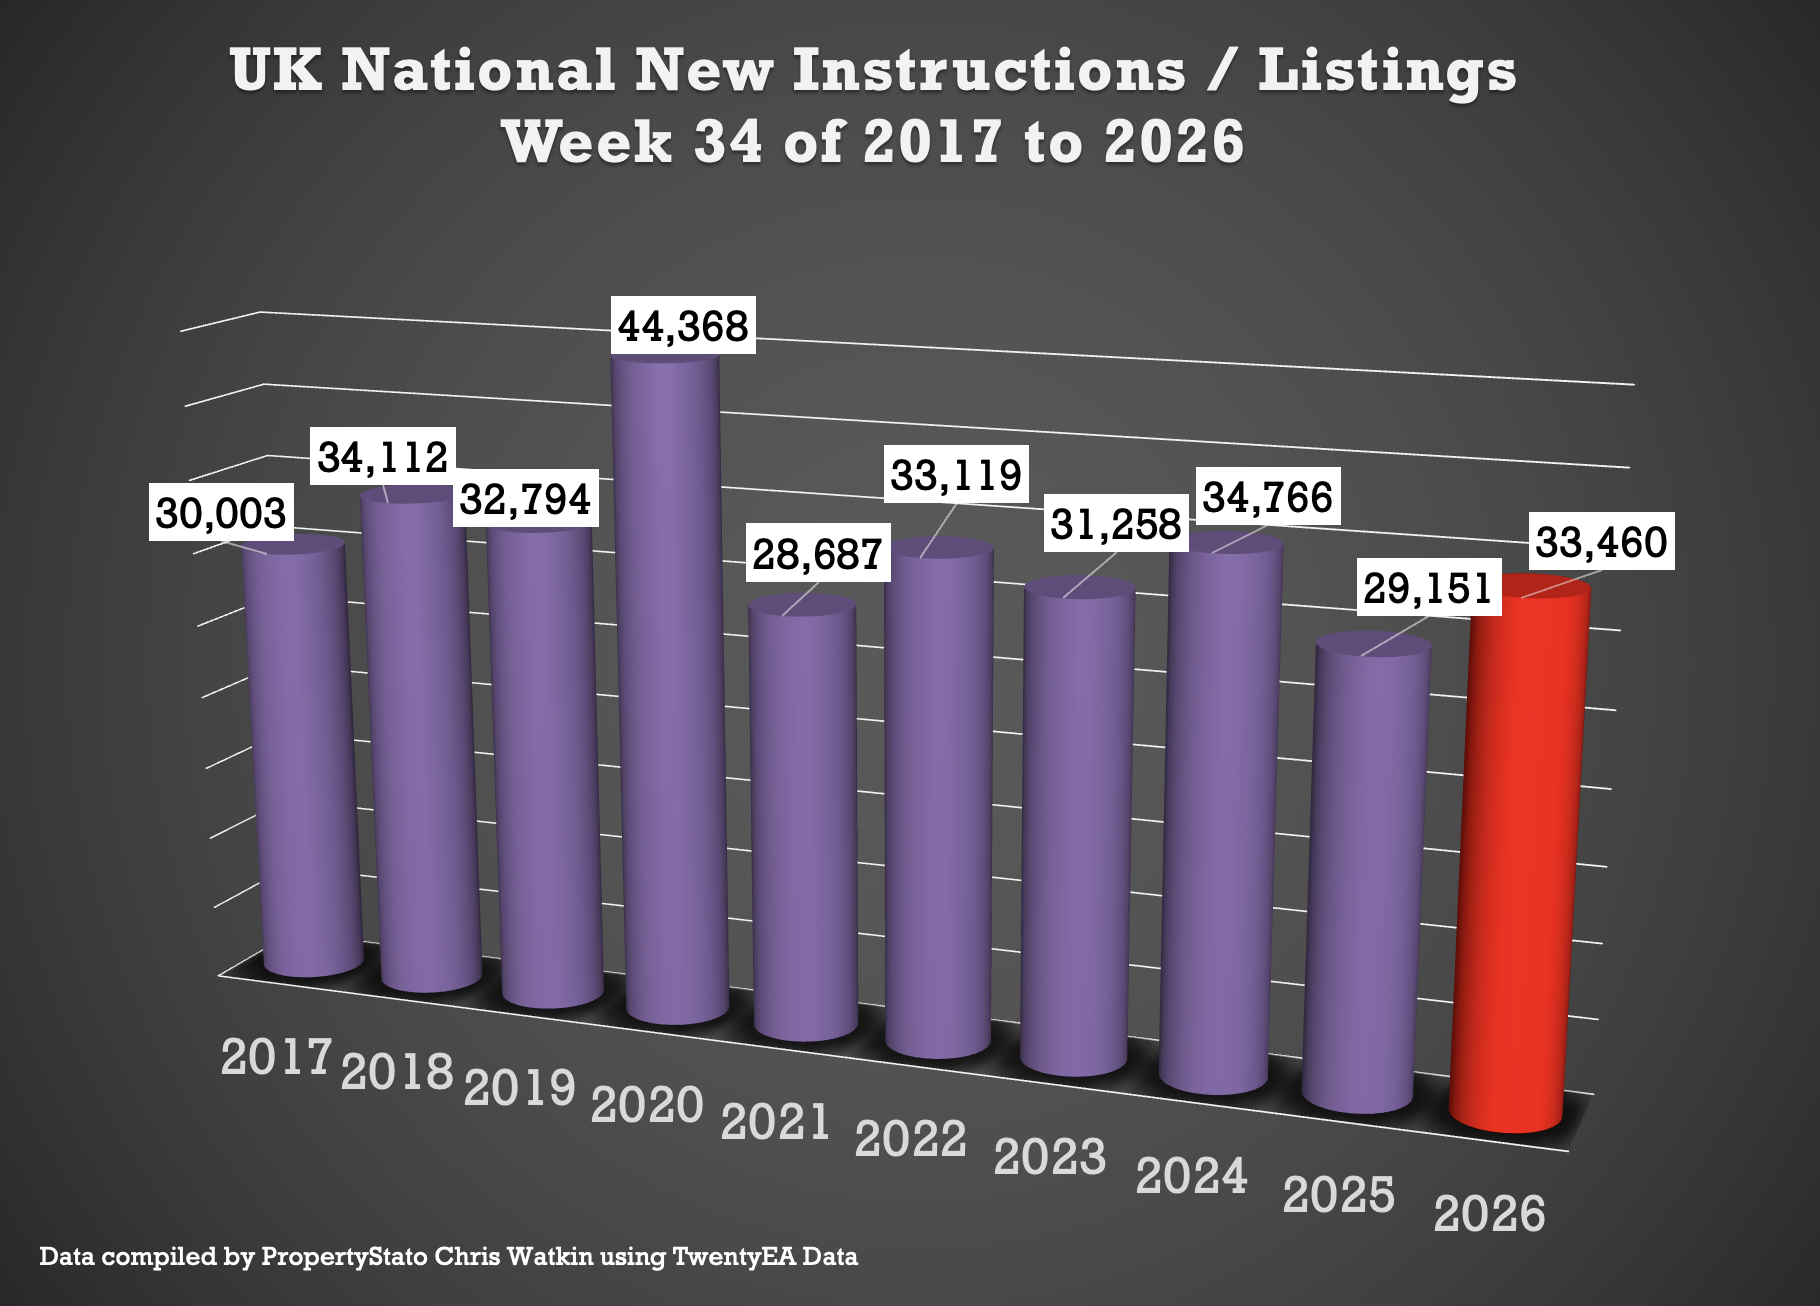
33.4k new listings this week, (31.8k last week).
Weekly 2026 average : 36.3k.
10 year week 34 average : 33.2k
Year to Date
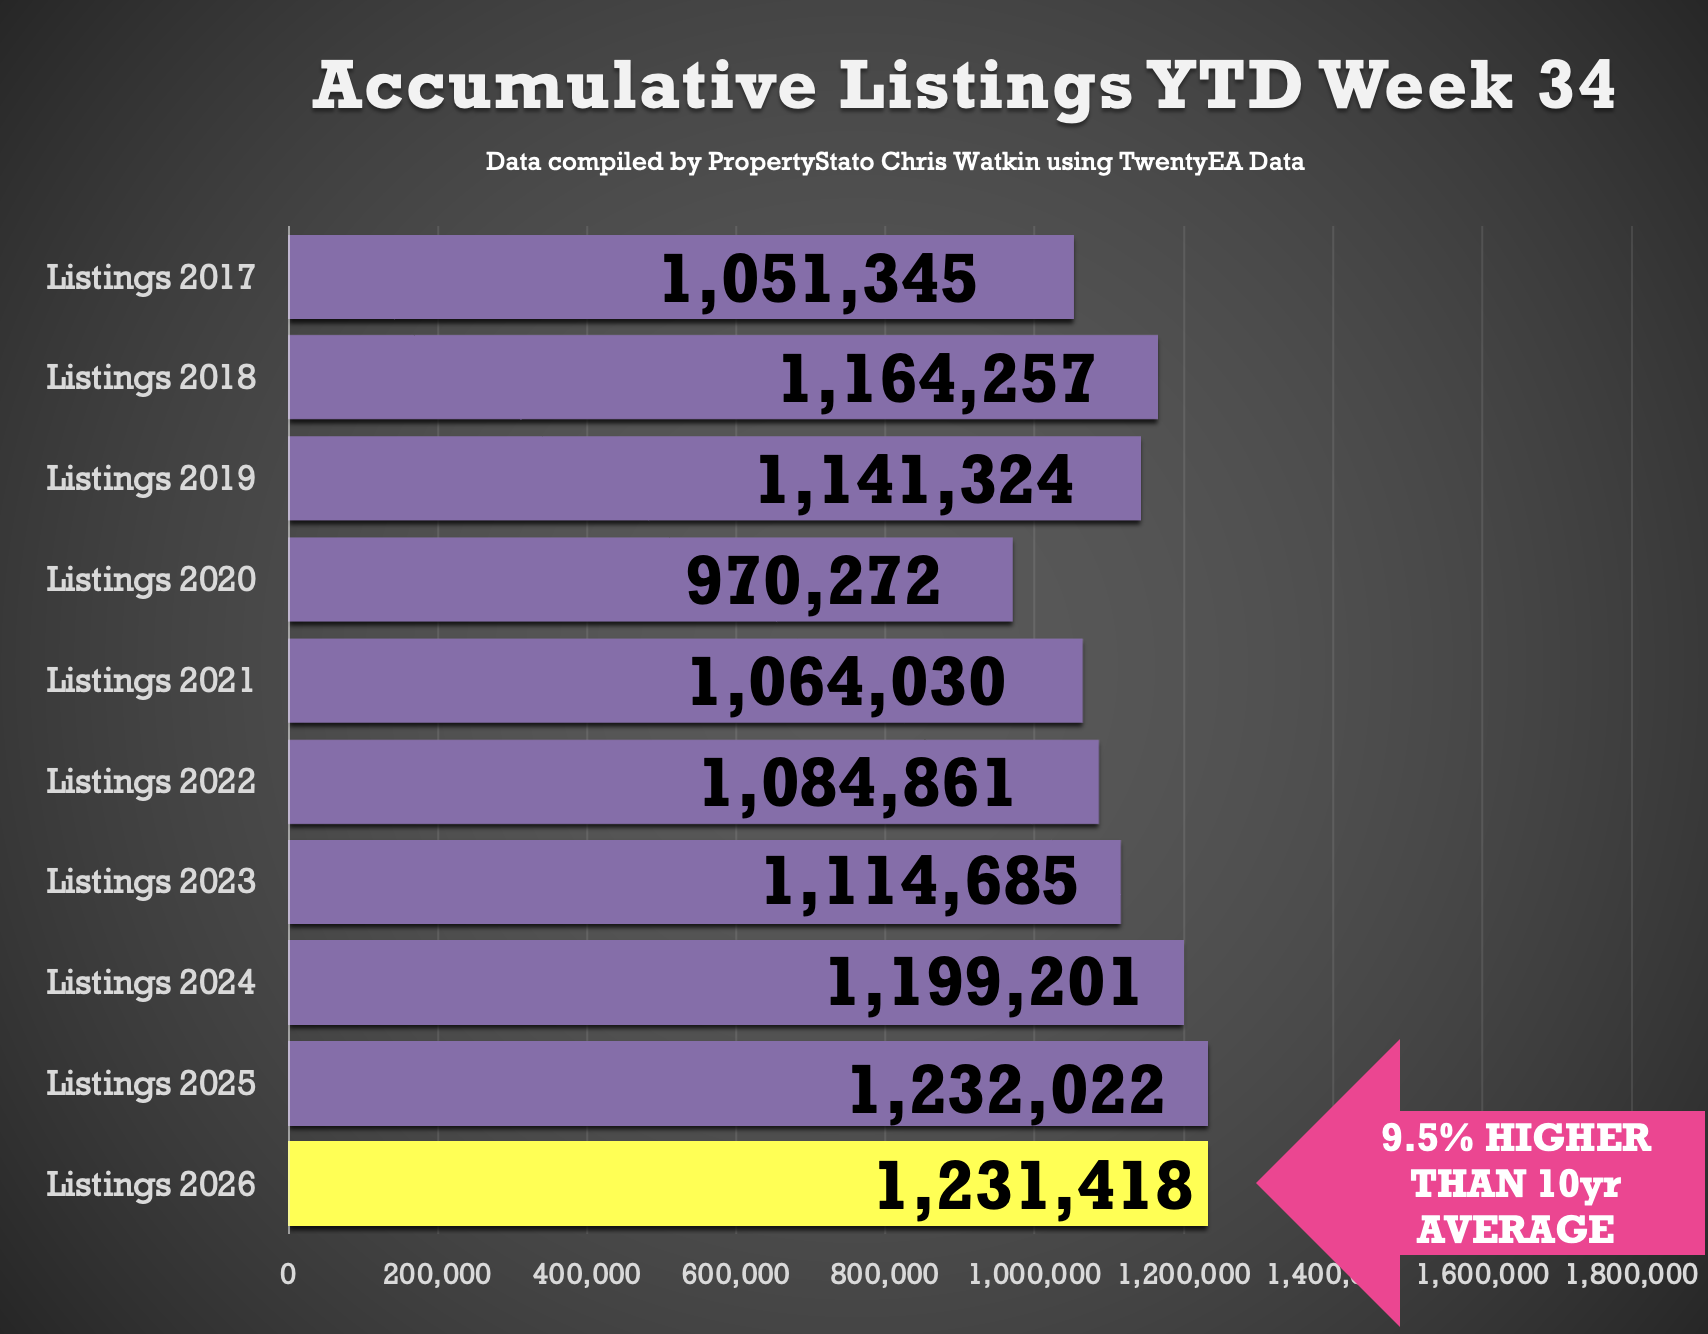
1.231m new listings YTD
Same as 2025 YTD (1.232m)
2.7% ahead of 2024 YTD (1.199m)
10.5% ahead of 2023 YTD (1084m)
10% higher than the 2017–19 average YTD (1.119m).
Decade average 1.125m.
🟩 UK Gross Resi Sales
Week 34..
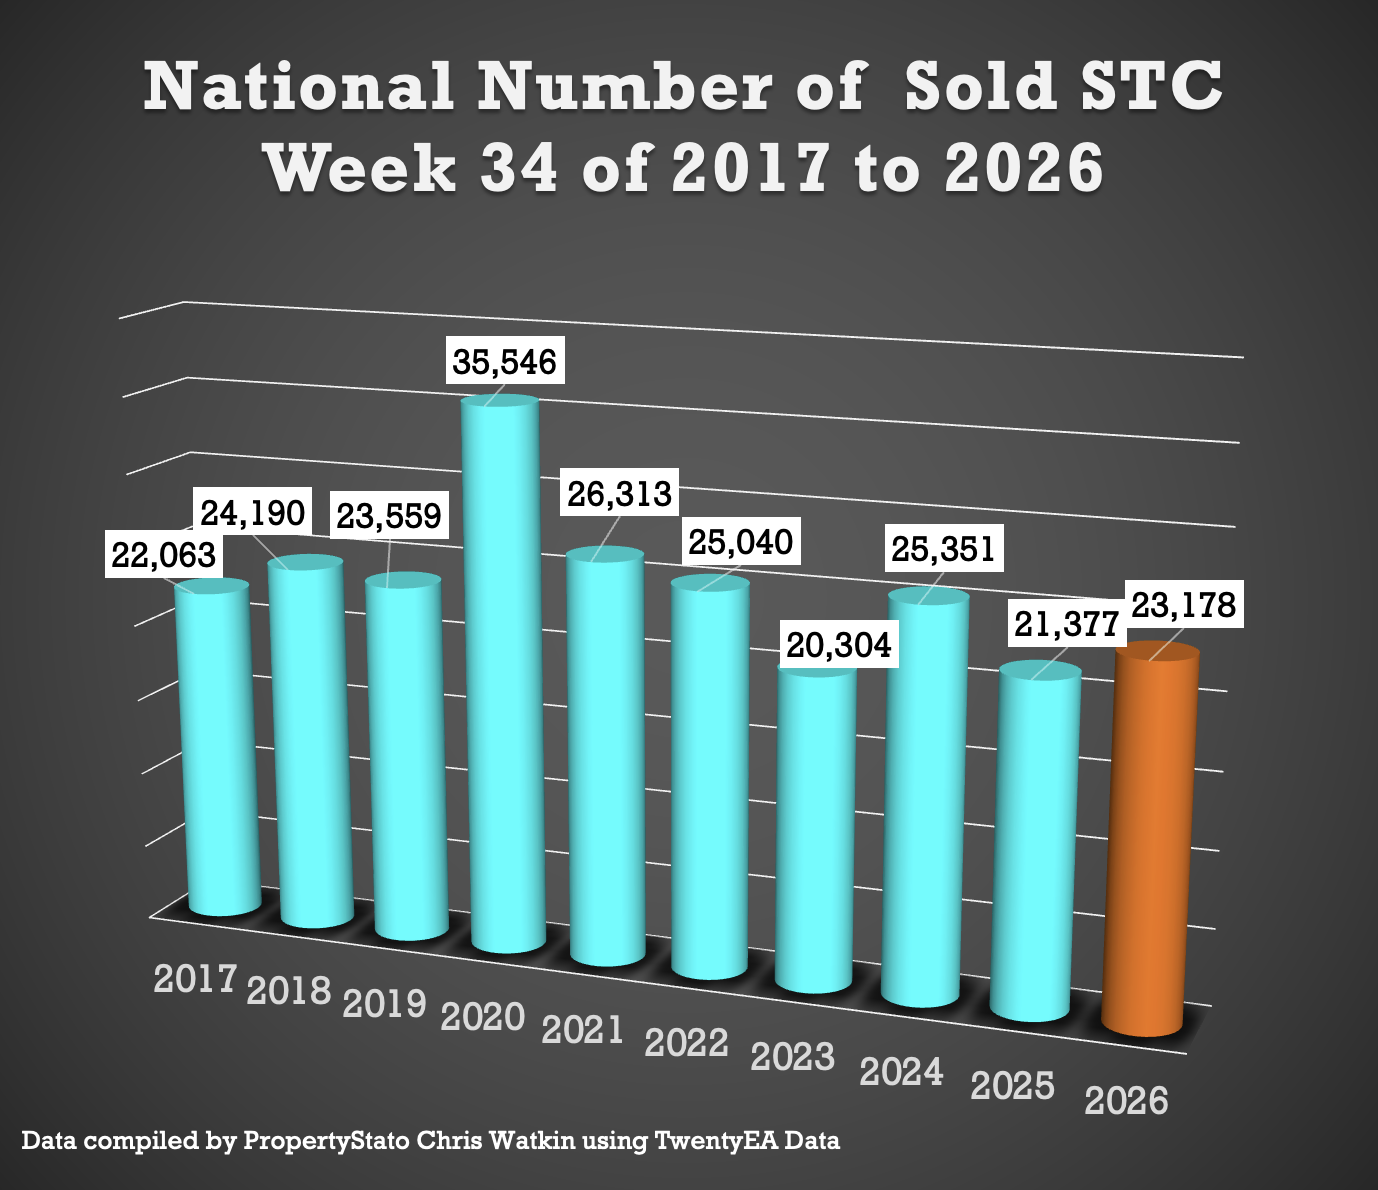
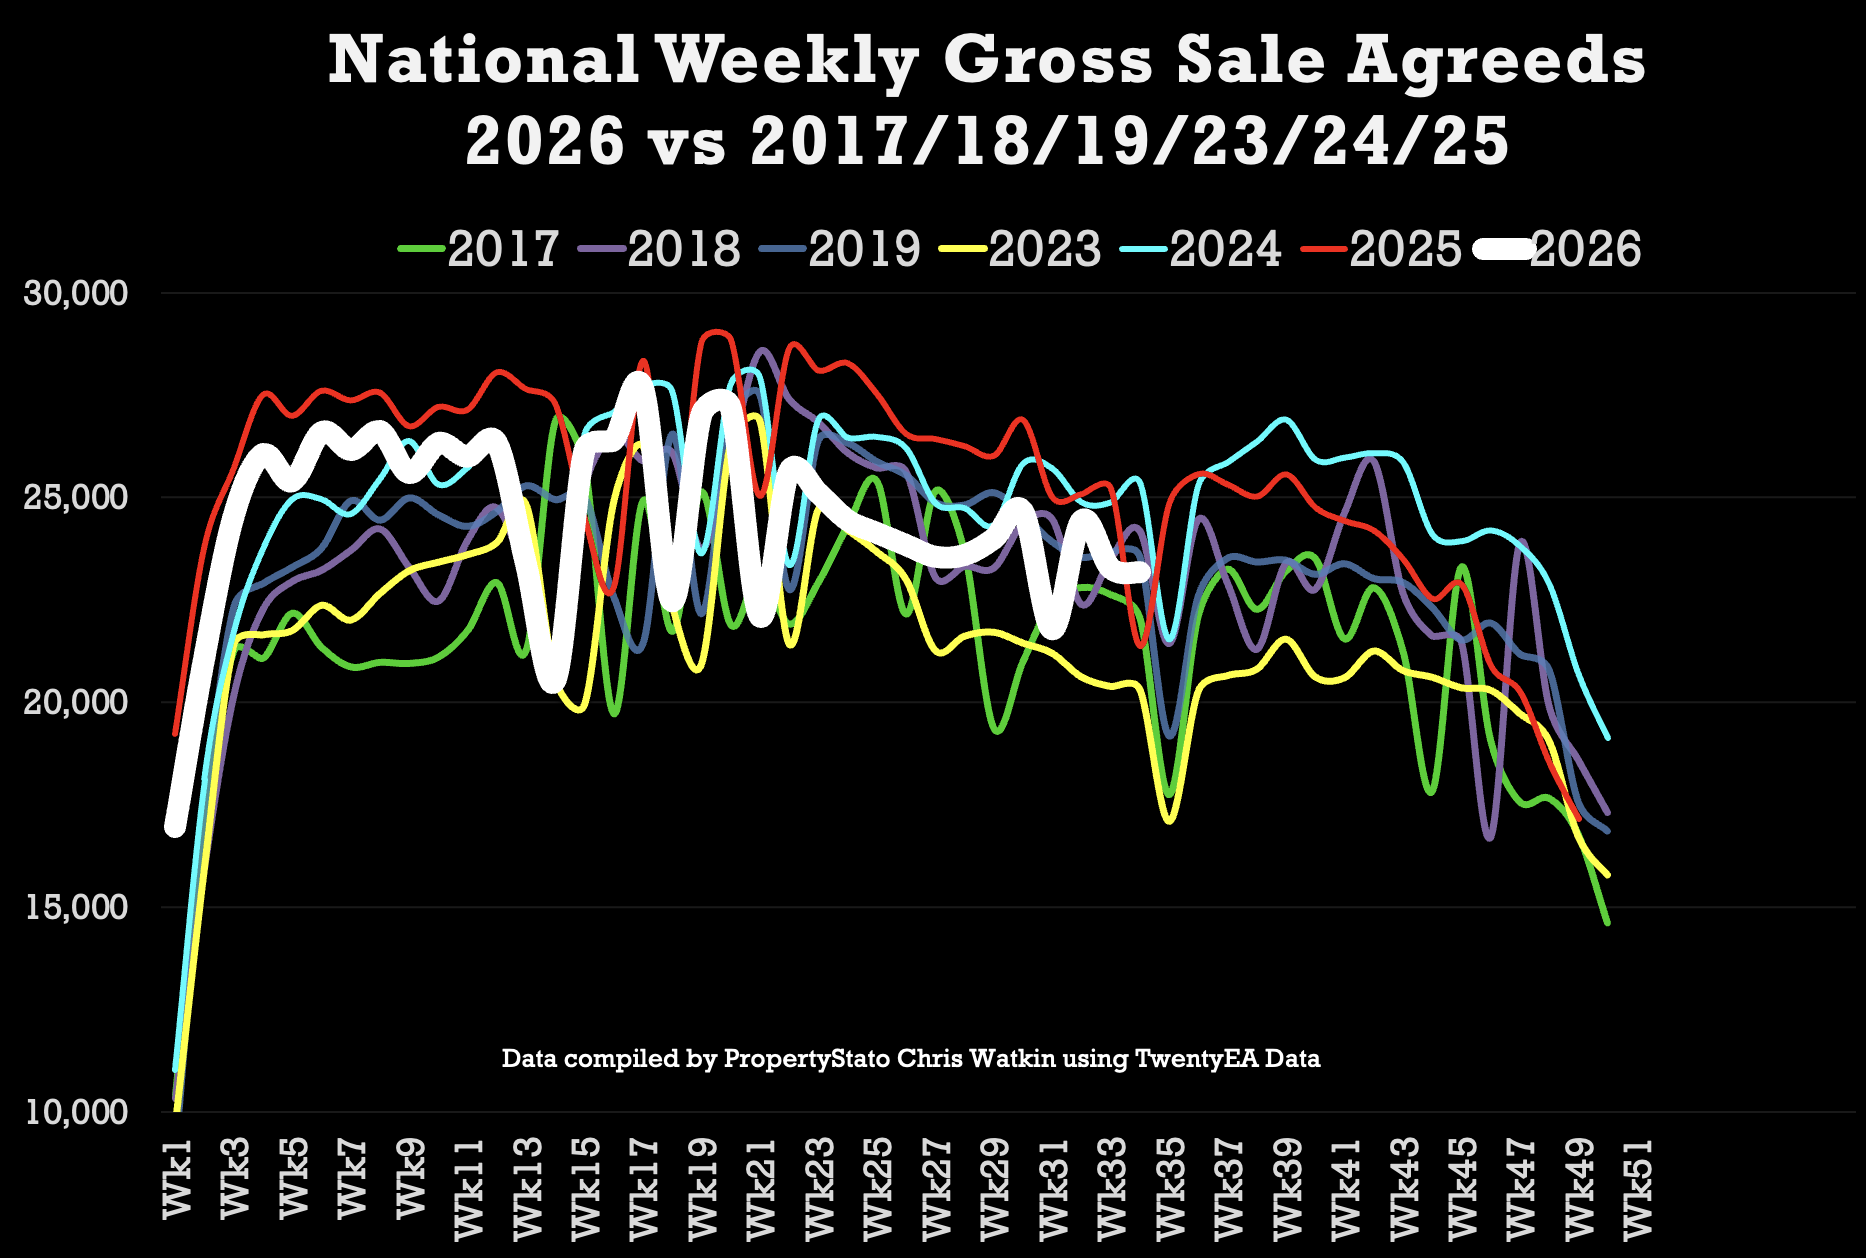
23.2k homes sold stc this week 33 (23.4k last week)
10 year week 34 average : 24.7k
2026 weekly average : 24.5k.
Year to Date for house sales
832k UK homes sold stc YTD
6.8% lower than 2025 YTD (893k)
1.1% lower to 2024 YTD (842k)
11% higher than 2023 YTD (750k)
5.7% higher above pre Covid 2017-19 years (789k).
Decade average – 833k YTD.
🟩 UK Net Resi Sales YTD
(Net Sales being Gross Sales less Sale Fall Thrus).
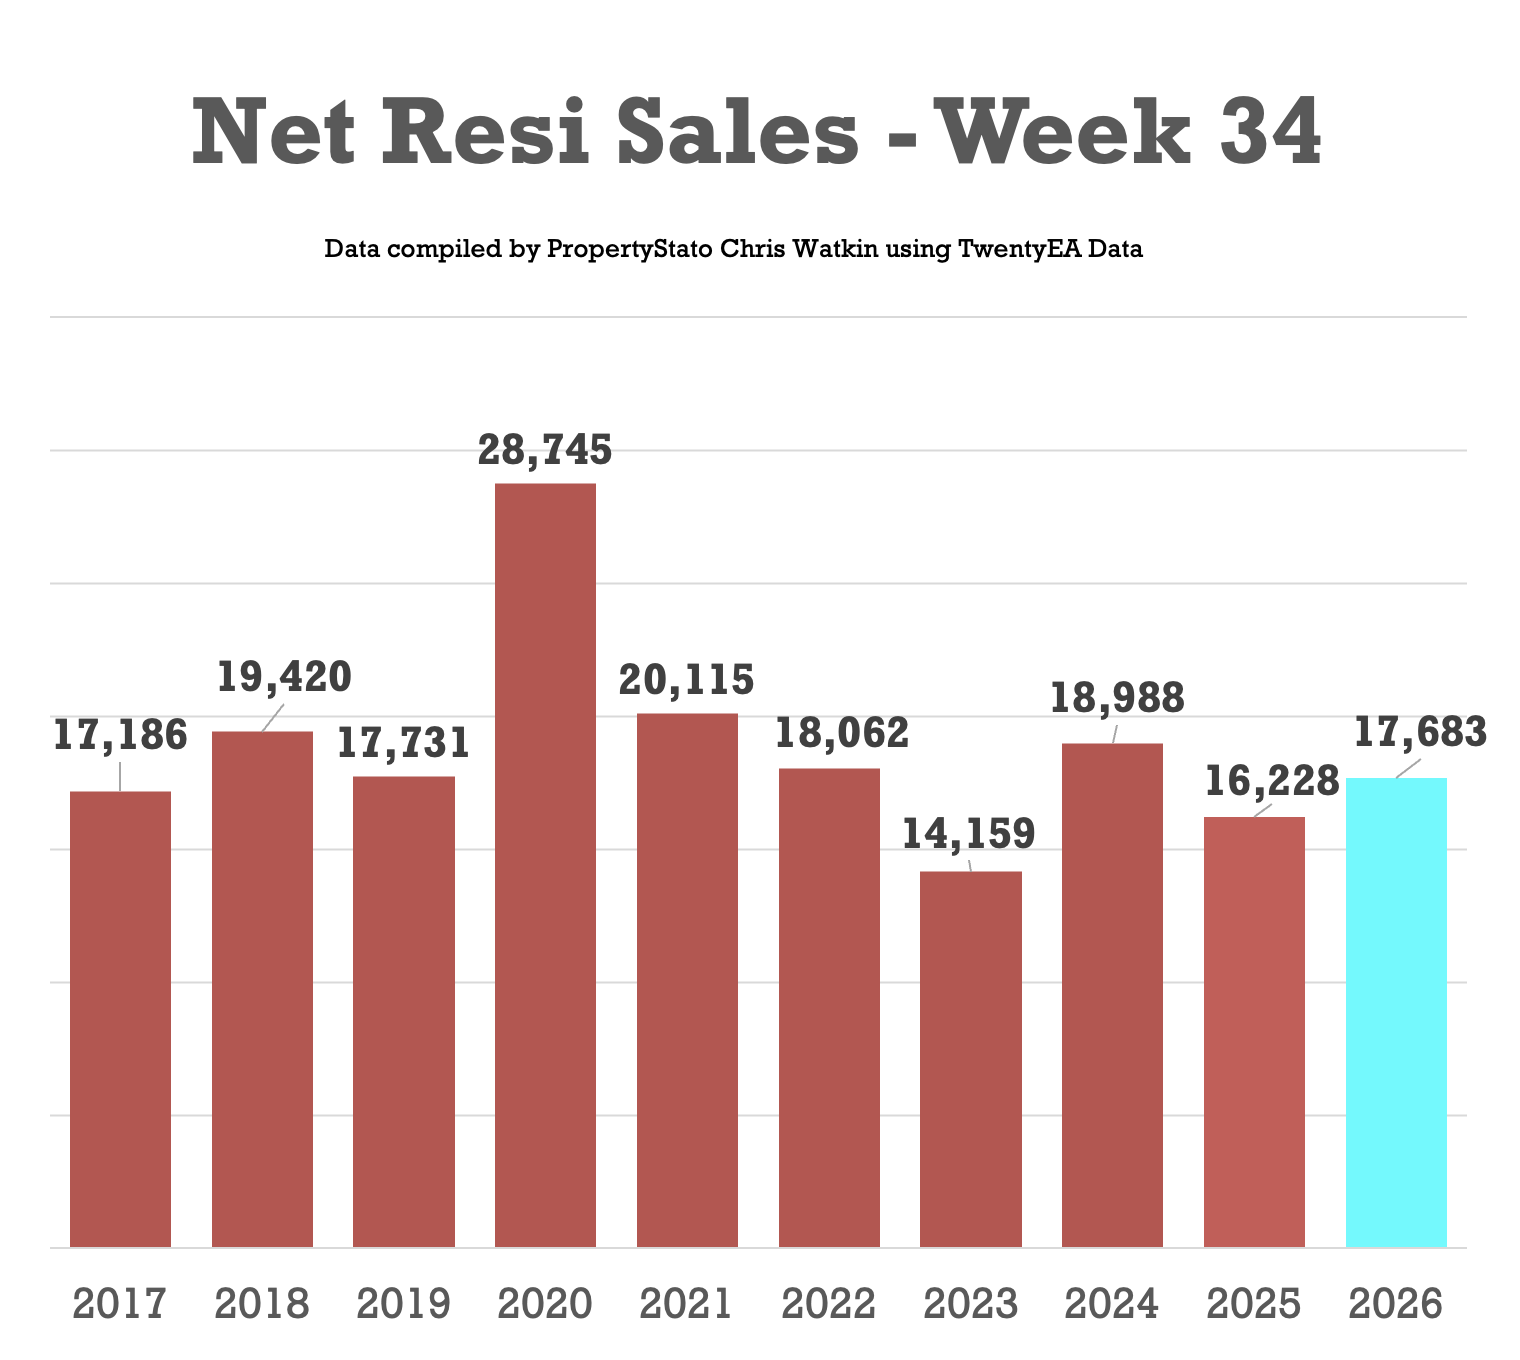
Week 34
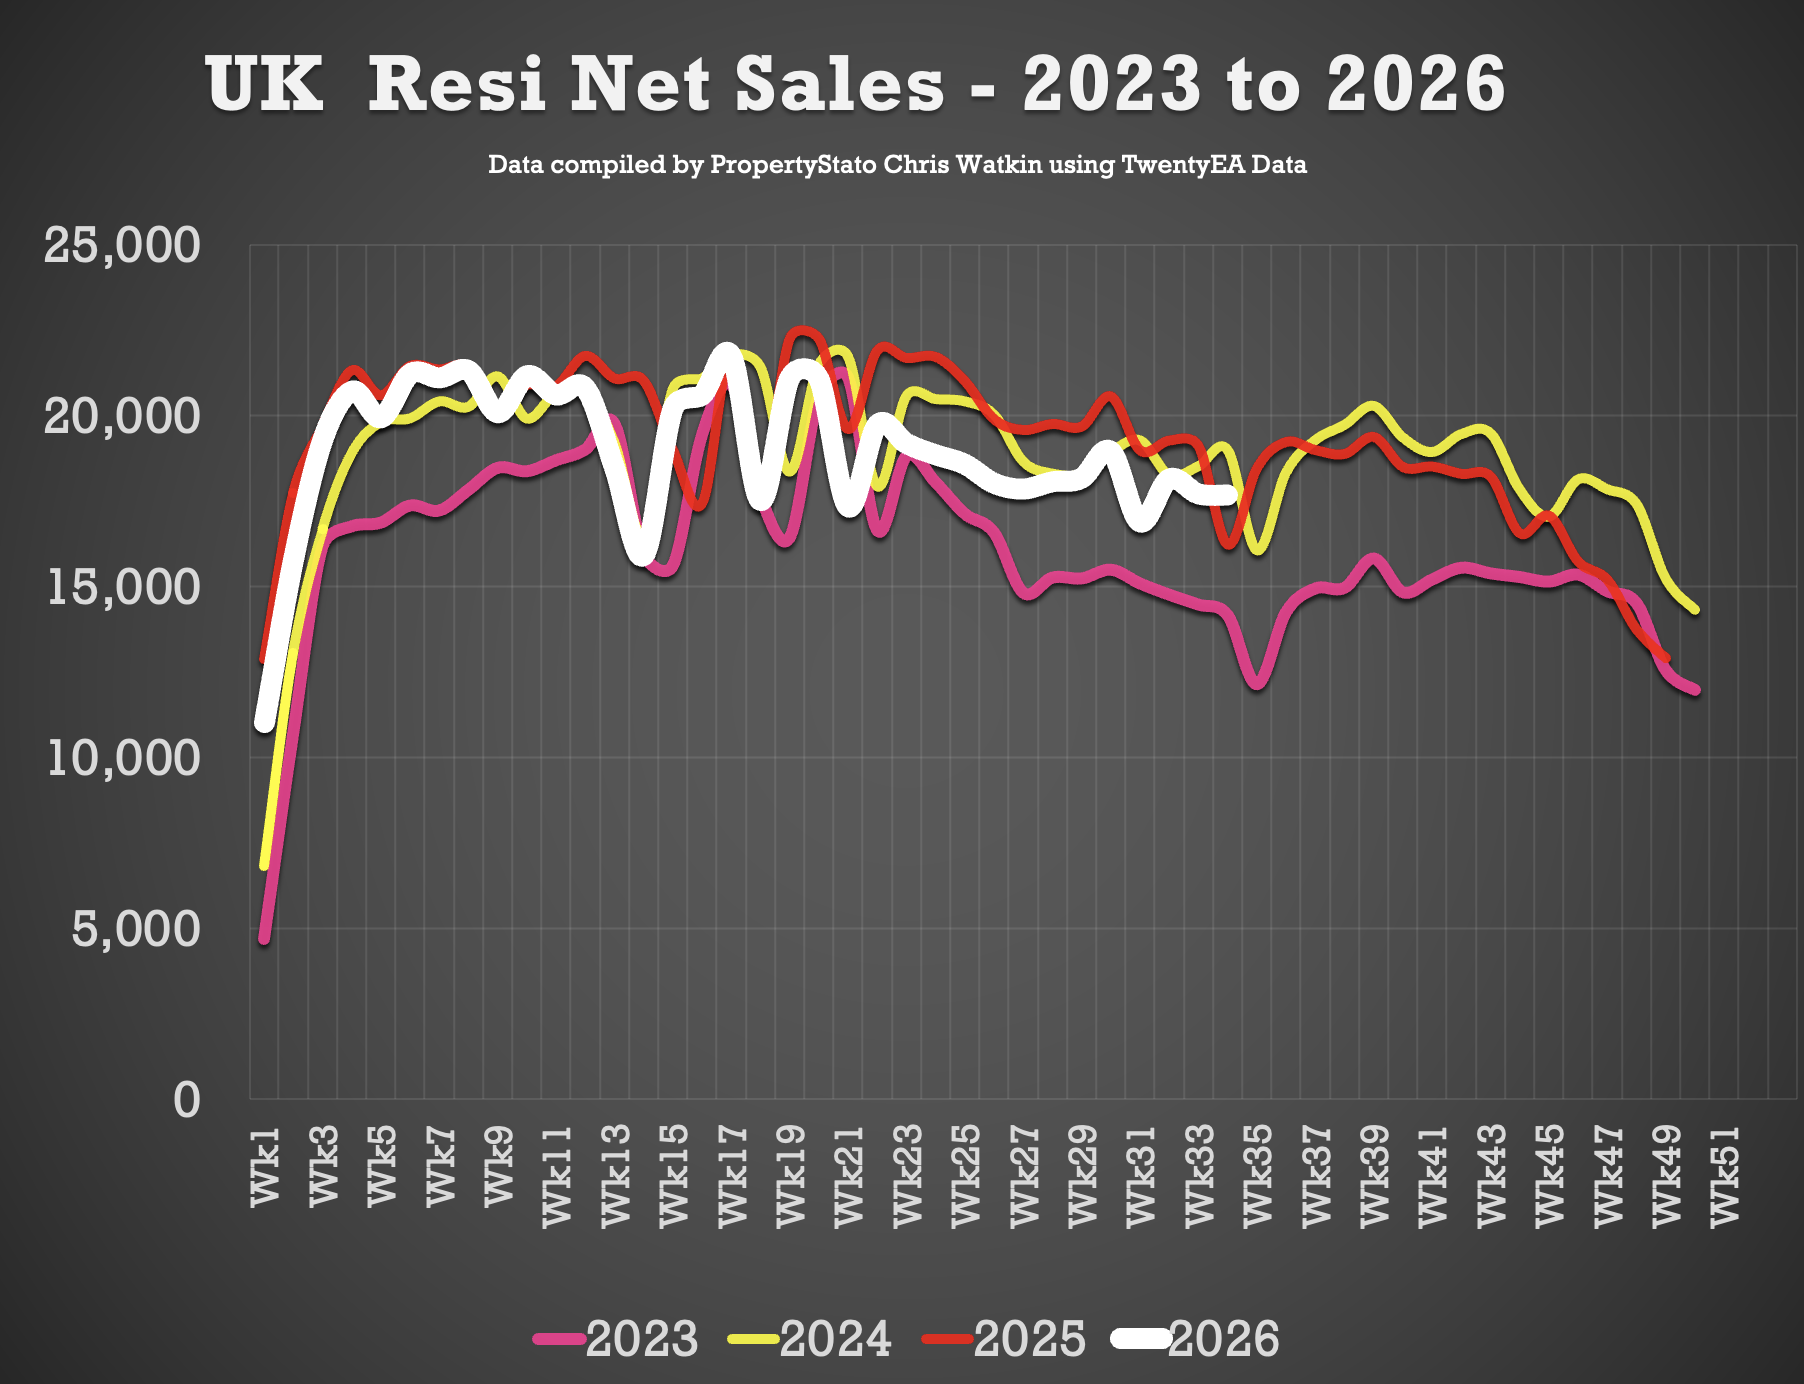
17.7k Net Sales (17.7k last week)
10 year Week 34 average: 18.3k.
Weekly average for 2026: 19k.
Year to Date
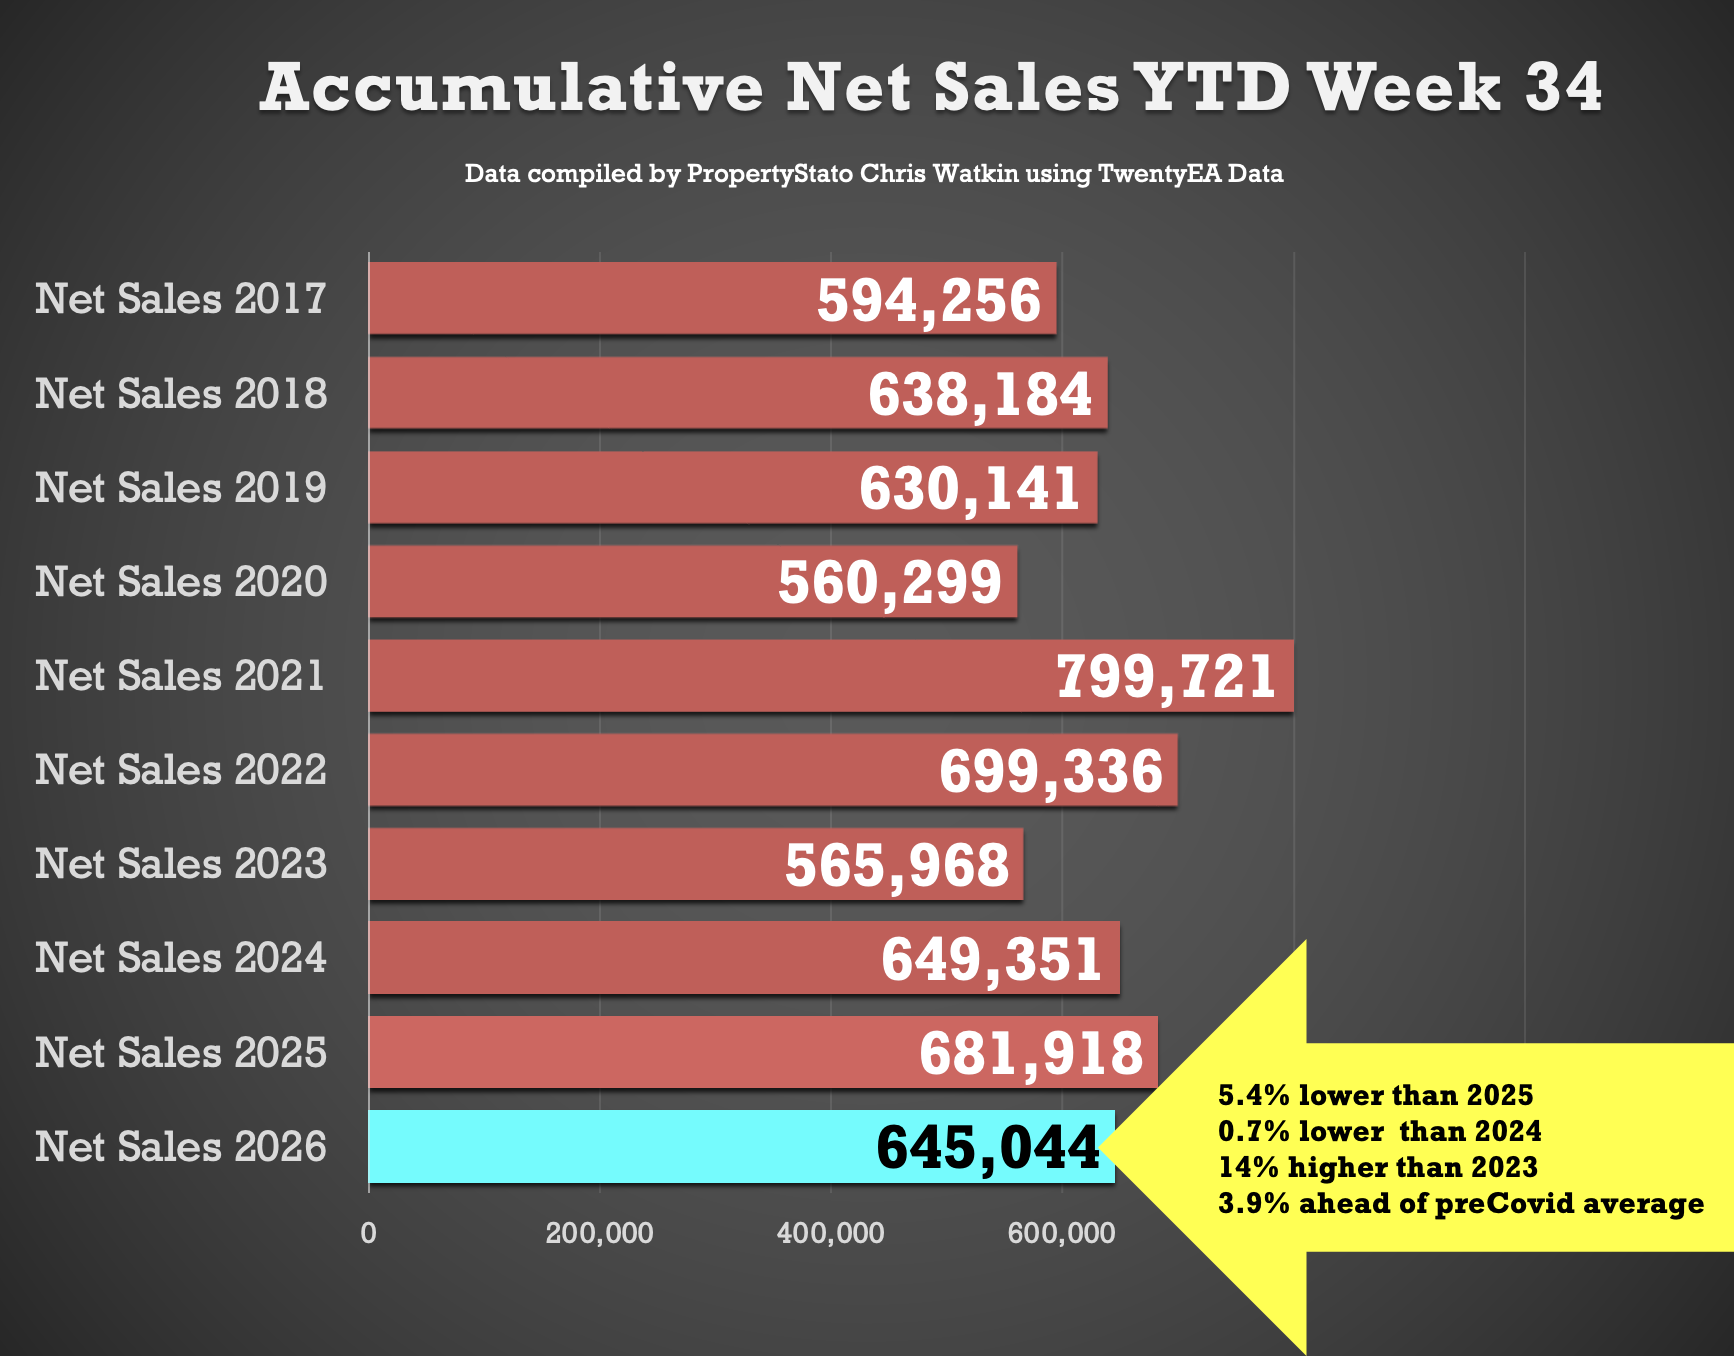
645k UK net home sales YTD
5.4% lower than 2025 (682k),
0.7% lower than 2024 (649k),
14% ahead of 2023 (566k)
3.9% above the 2017/18/19 average (621k).
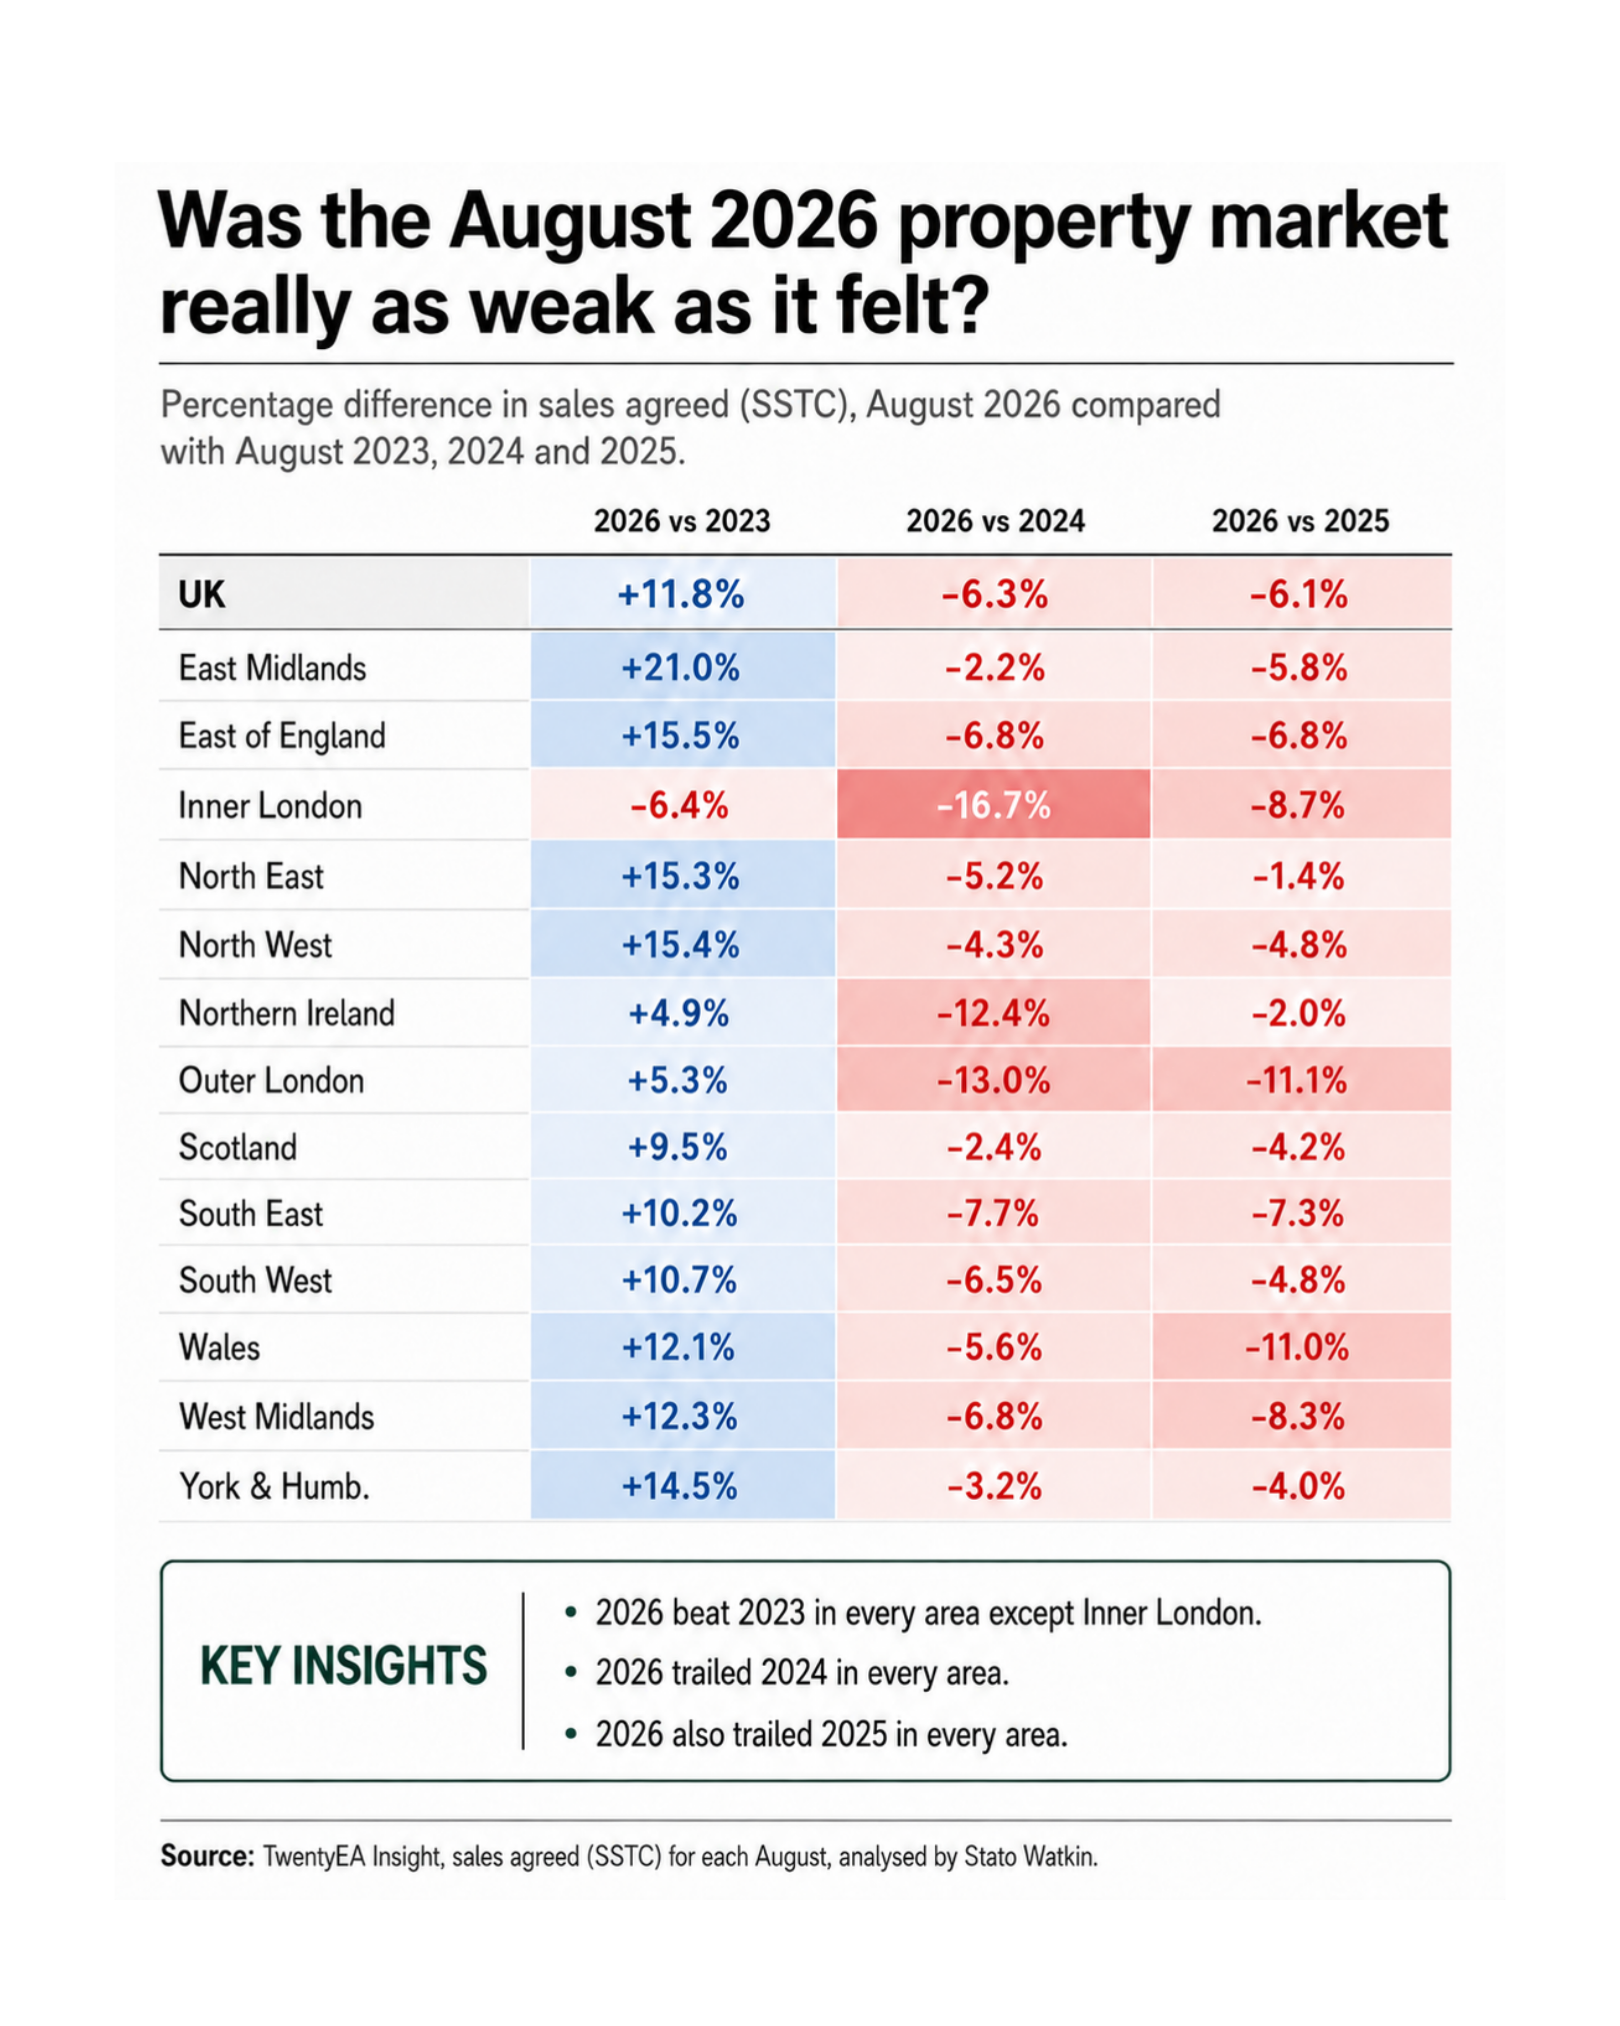
🟩 August 26 vs August 25 vs August 24 vs August 23 – Resi Gross Sales – Regional and National
+ August 2026 saw 97.9k sales agreed, compared with 104.5k in 2024, 104.4k in 2025 and 87.6k in 2023.
+ So while 2026 is softer than the previous two Augusts, it is still comfortably ahead of 2023.
+ With more homes competing for buyers, realistic pricing matters, especially as 8 in 10 homes that have listed & sold stc this year did so without a price reduction.
🟩 Exchanges & Withdrawals
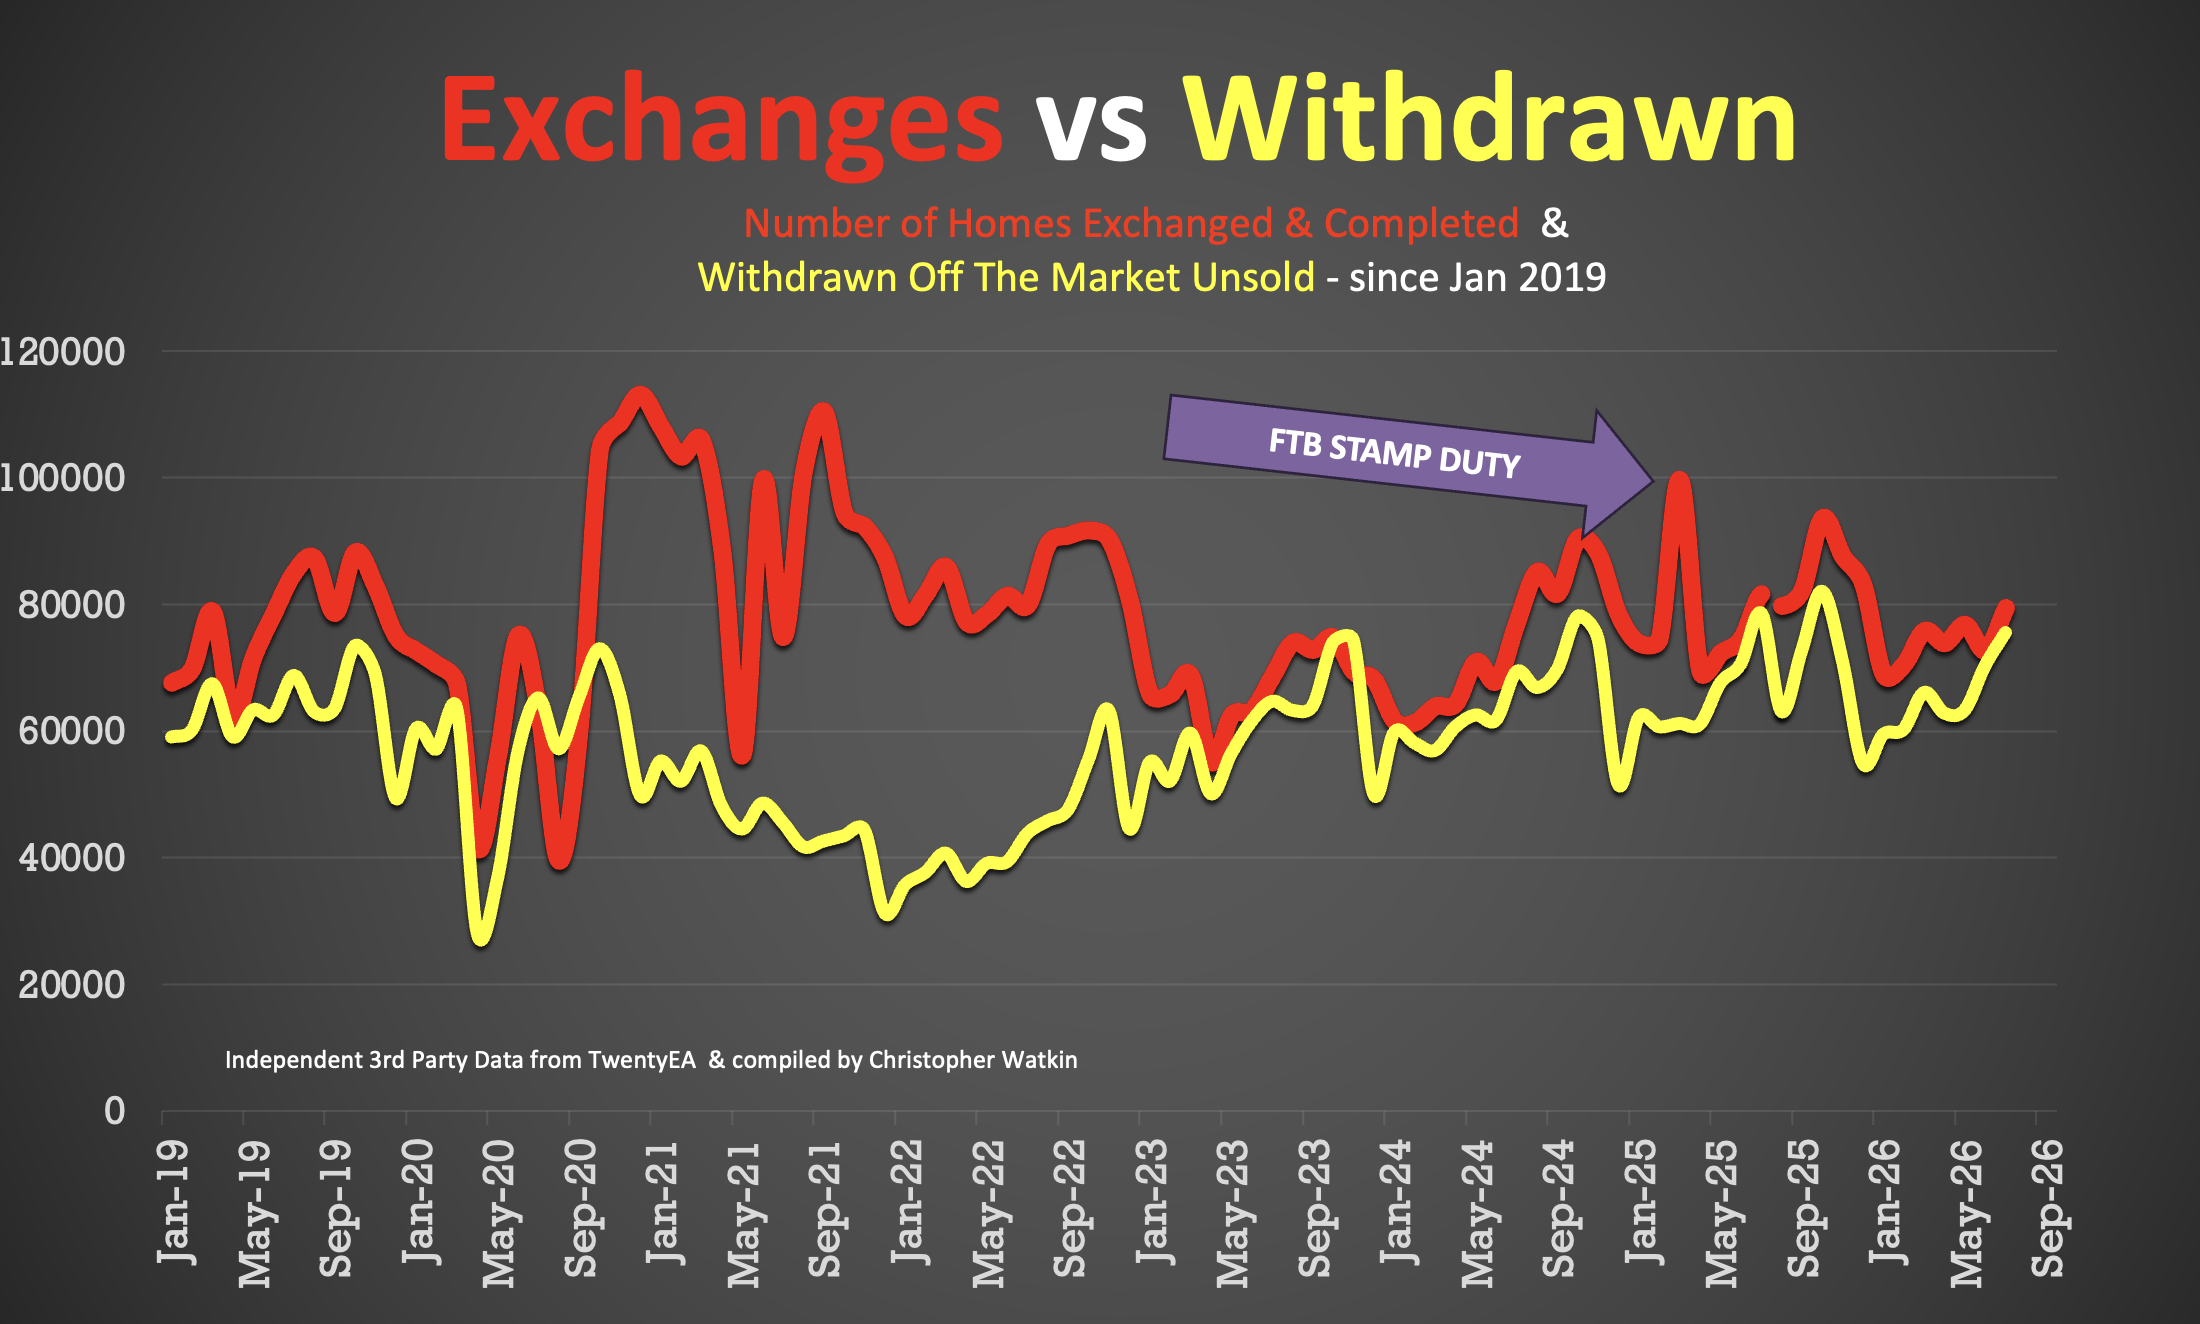
• 79.5k Exchanges in July 2026 (August figures to follow).
• 75.6k Withdrawals in July 2026
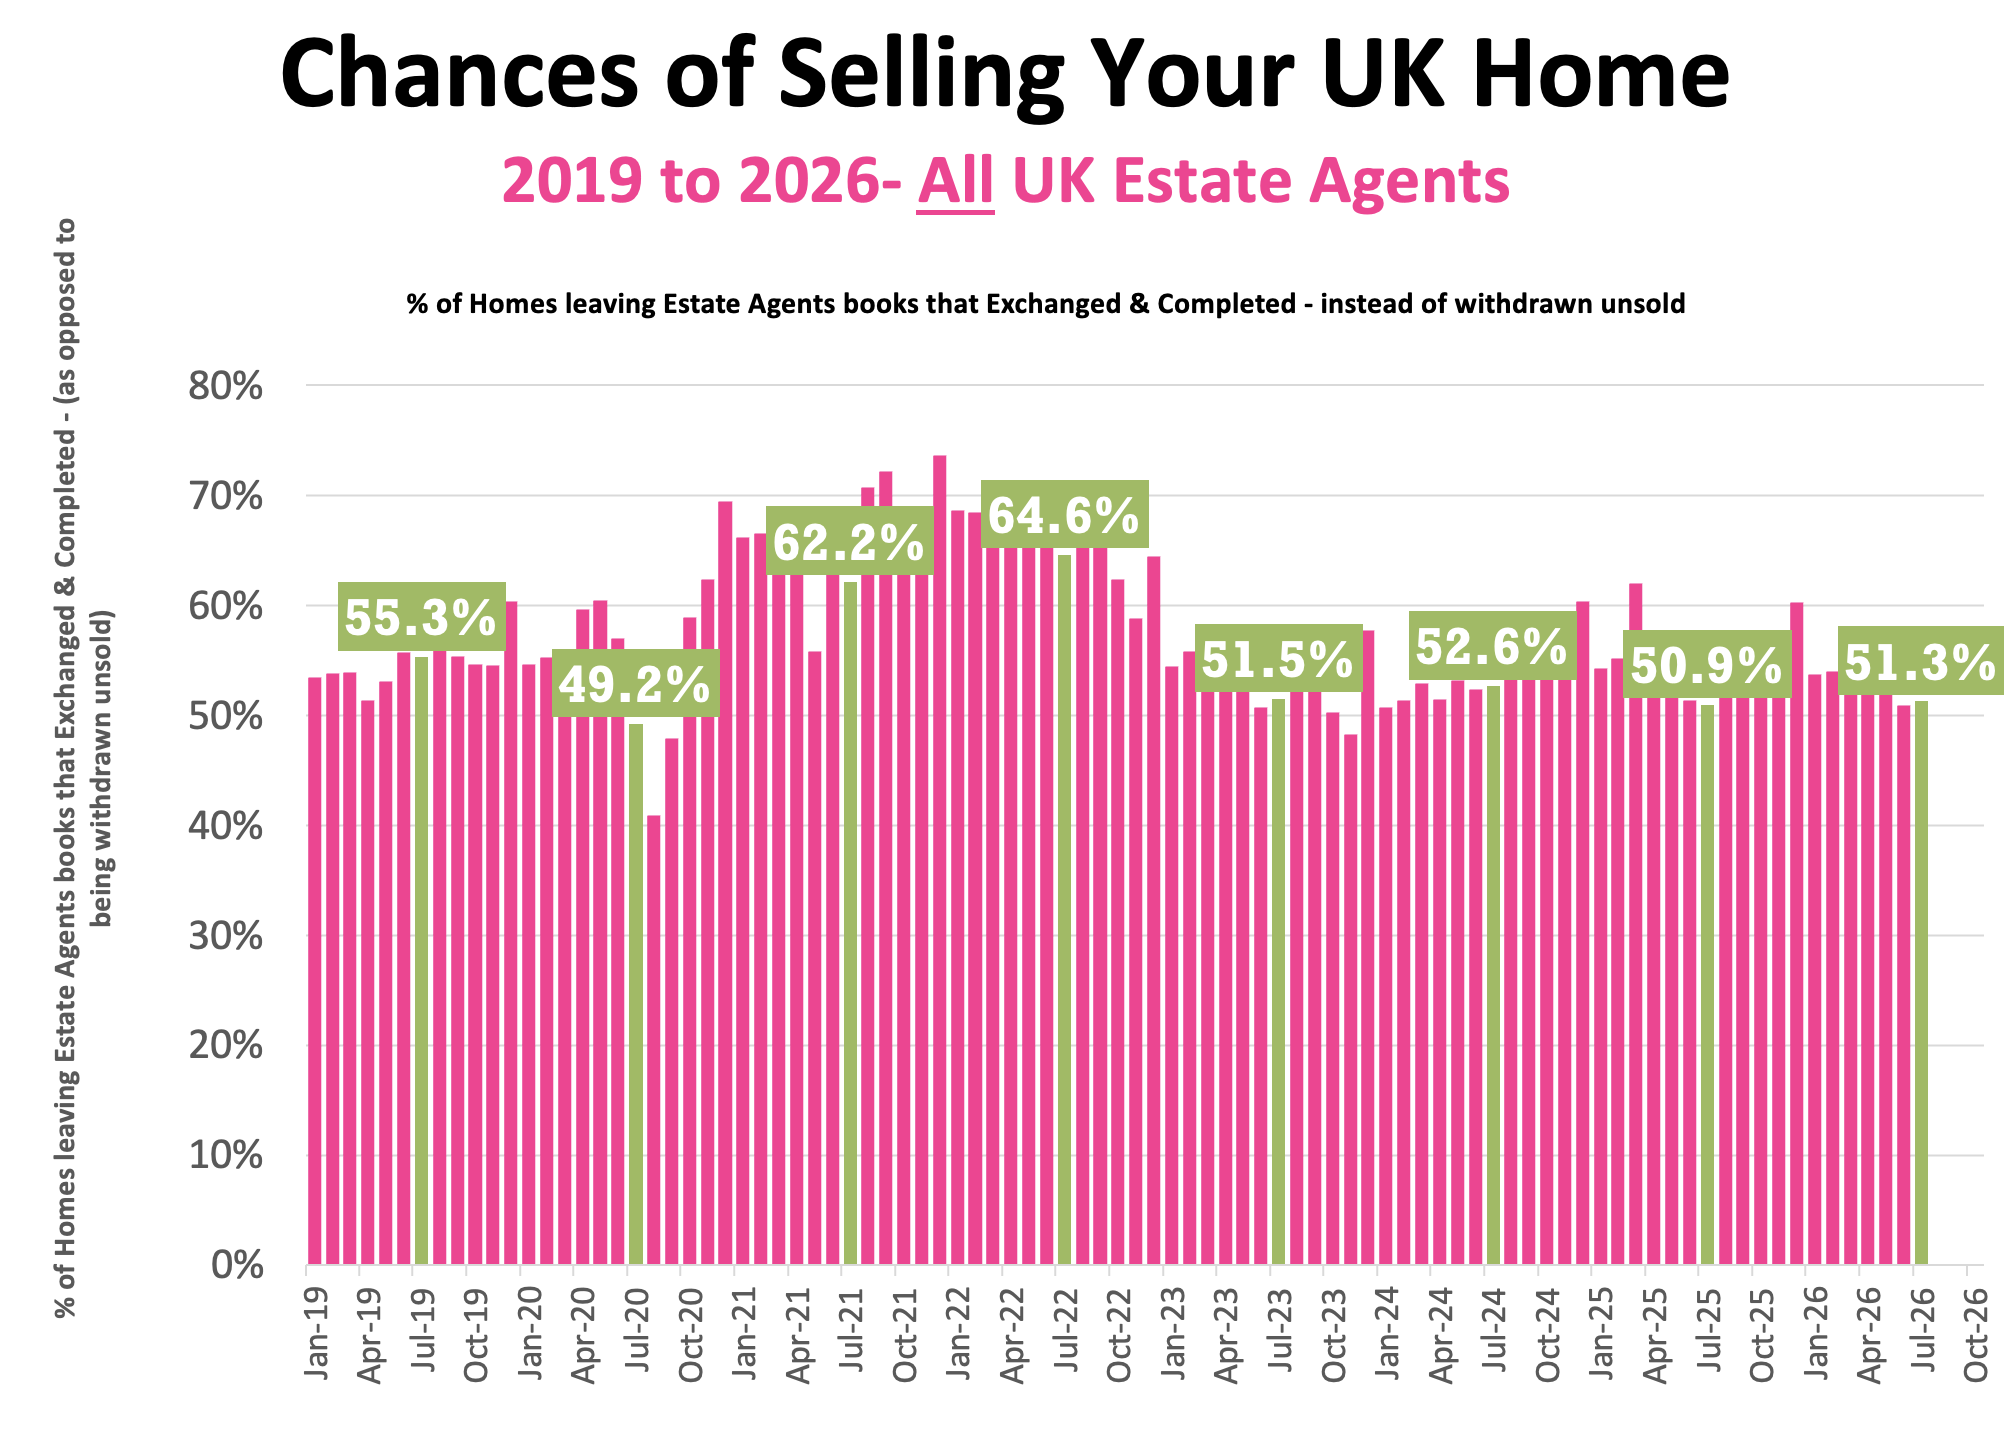
• Therefore, in July 2026, only 51.3% of homes that left agents’ books exchanged & completed in July (the rest – 49% withdrew, unsold)
• 57.6% is the 7 year average exchange to listings ratio (which includes the crazy years post lockdown 18 months).
Additional info …
🟥 Price Reductions
• 20.9k reductions this week on 767k UK homes for sale
• 13.7% of UK homes for sale were reduced in July (down from 14.3% in June)
• 2026 YTD average 13%, versus the 6-year long-term average of 11.2%.
🟥 Price Difference between Asking Price of Listings & Asking Price of those Homes that go Sold stc
• Week 34 – 12.6% difference (long term 10 year average is 16% to 17%). (£393k ave Listing Ave Asking price vs £349k Sale Agreed ave. Asking price)
🟥 Sell-Through Rate
• 14.2% of homes on agents’ books went SSTC in July ’26 (compared to 13.8% in June ’26).
• Pre-Covid average: 15.5%.
🟥 Sale Fall-Thrus
• Week 34 Fall-thru rate 23.7%
• Decade average: 24.5%
• 5.32% of homes sold STC fell thru in July 2026. The 2025 average of 5.3% and the 10 year average of 5.8%.
🟥 House Prices (£/sq.ft)
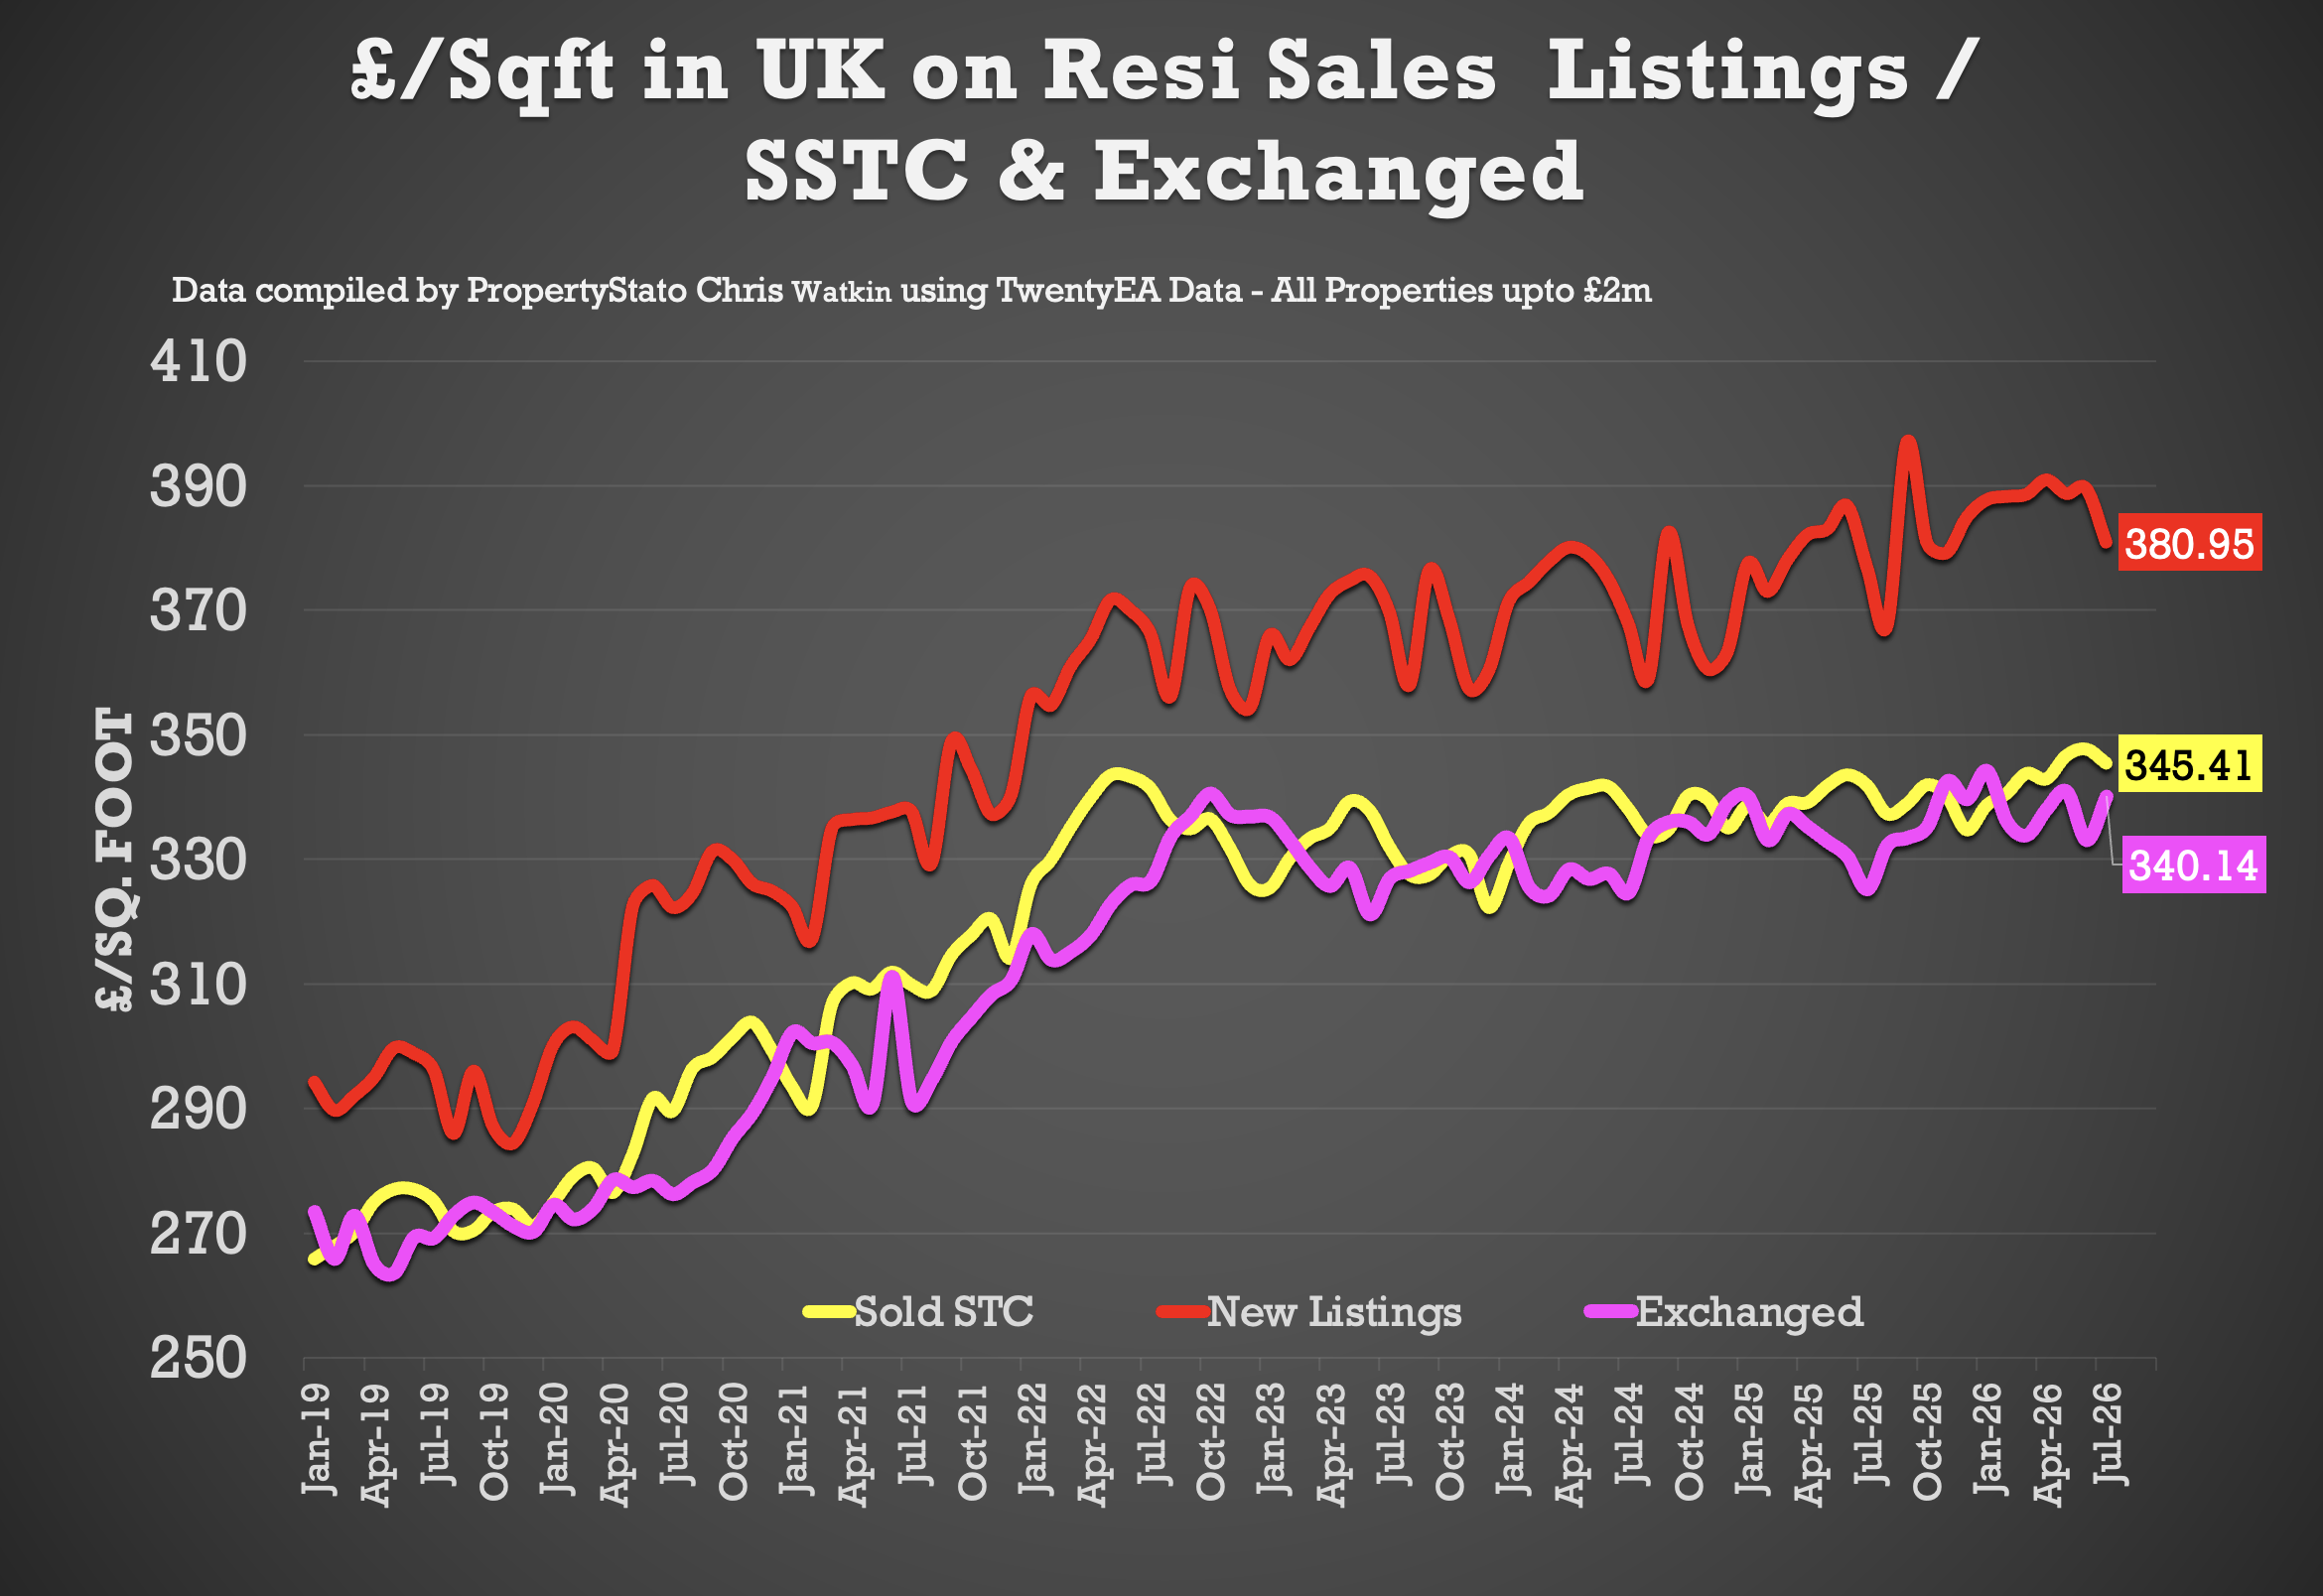
• July ’26 agreed sales averaged £345.41 per sq.ft. 1.2% higher than 12 months ago (£341.43) and 11.9% than 5 years ago (£308.60). The £/sqft at sale agreed matches the HM Land Registry Index with a 98% accuracy, 5 months in advance. That is why it is so important.
🟥 Stock Levels
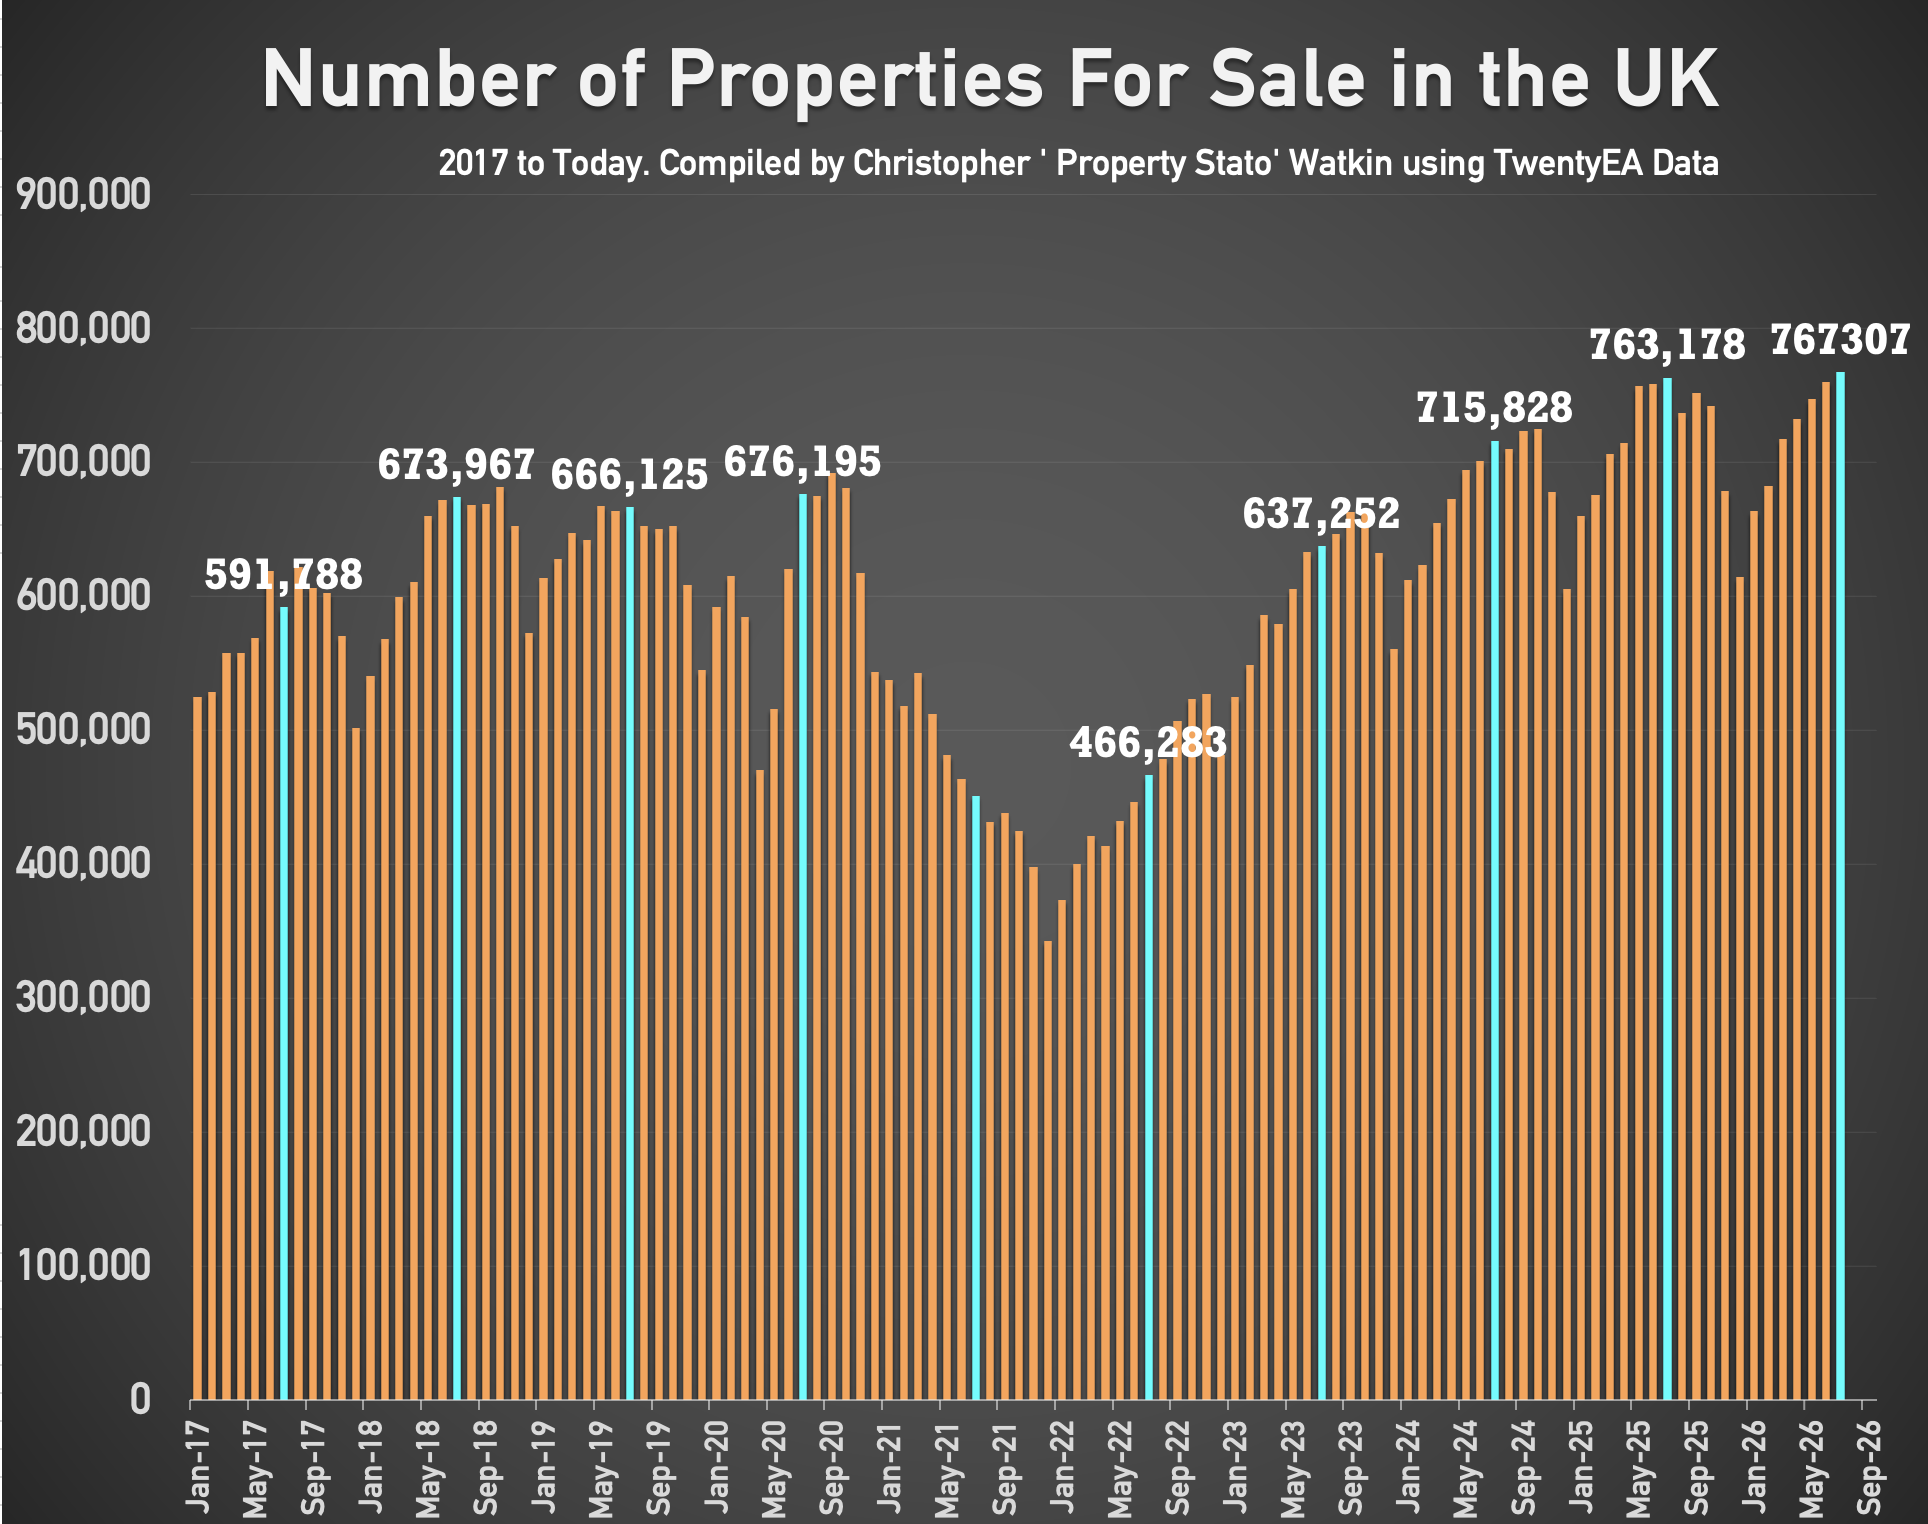
• 767k homes on the market on the 1st of August ’26 (760k the month before and 763k 12 months ago)
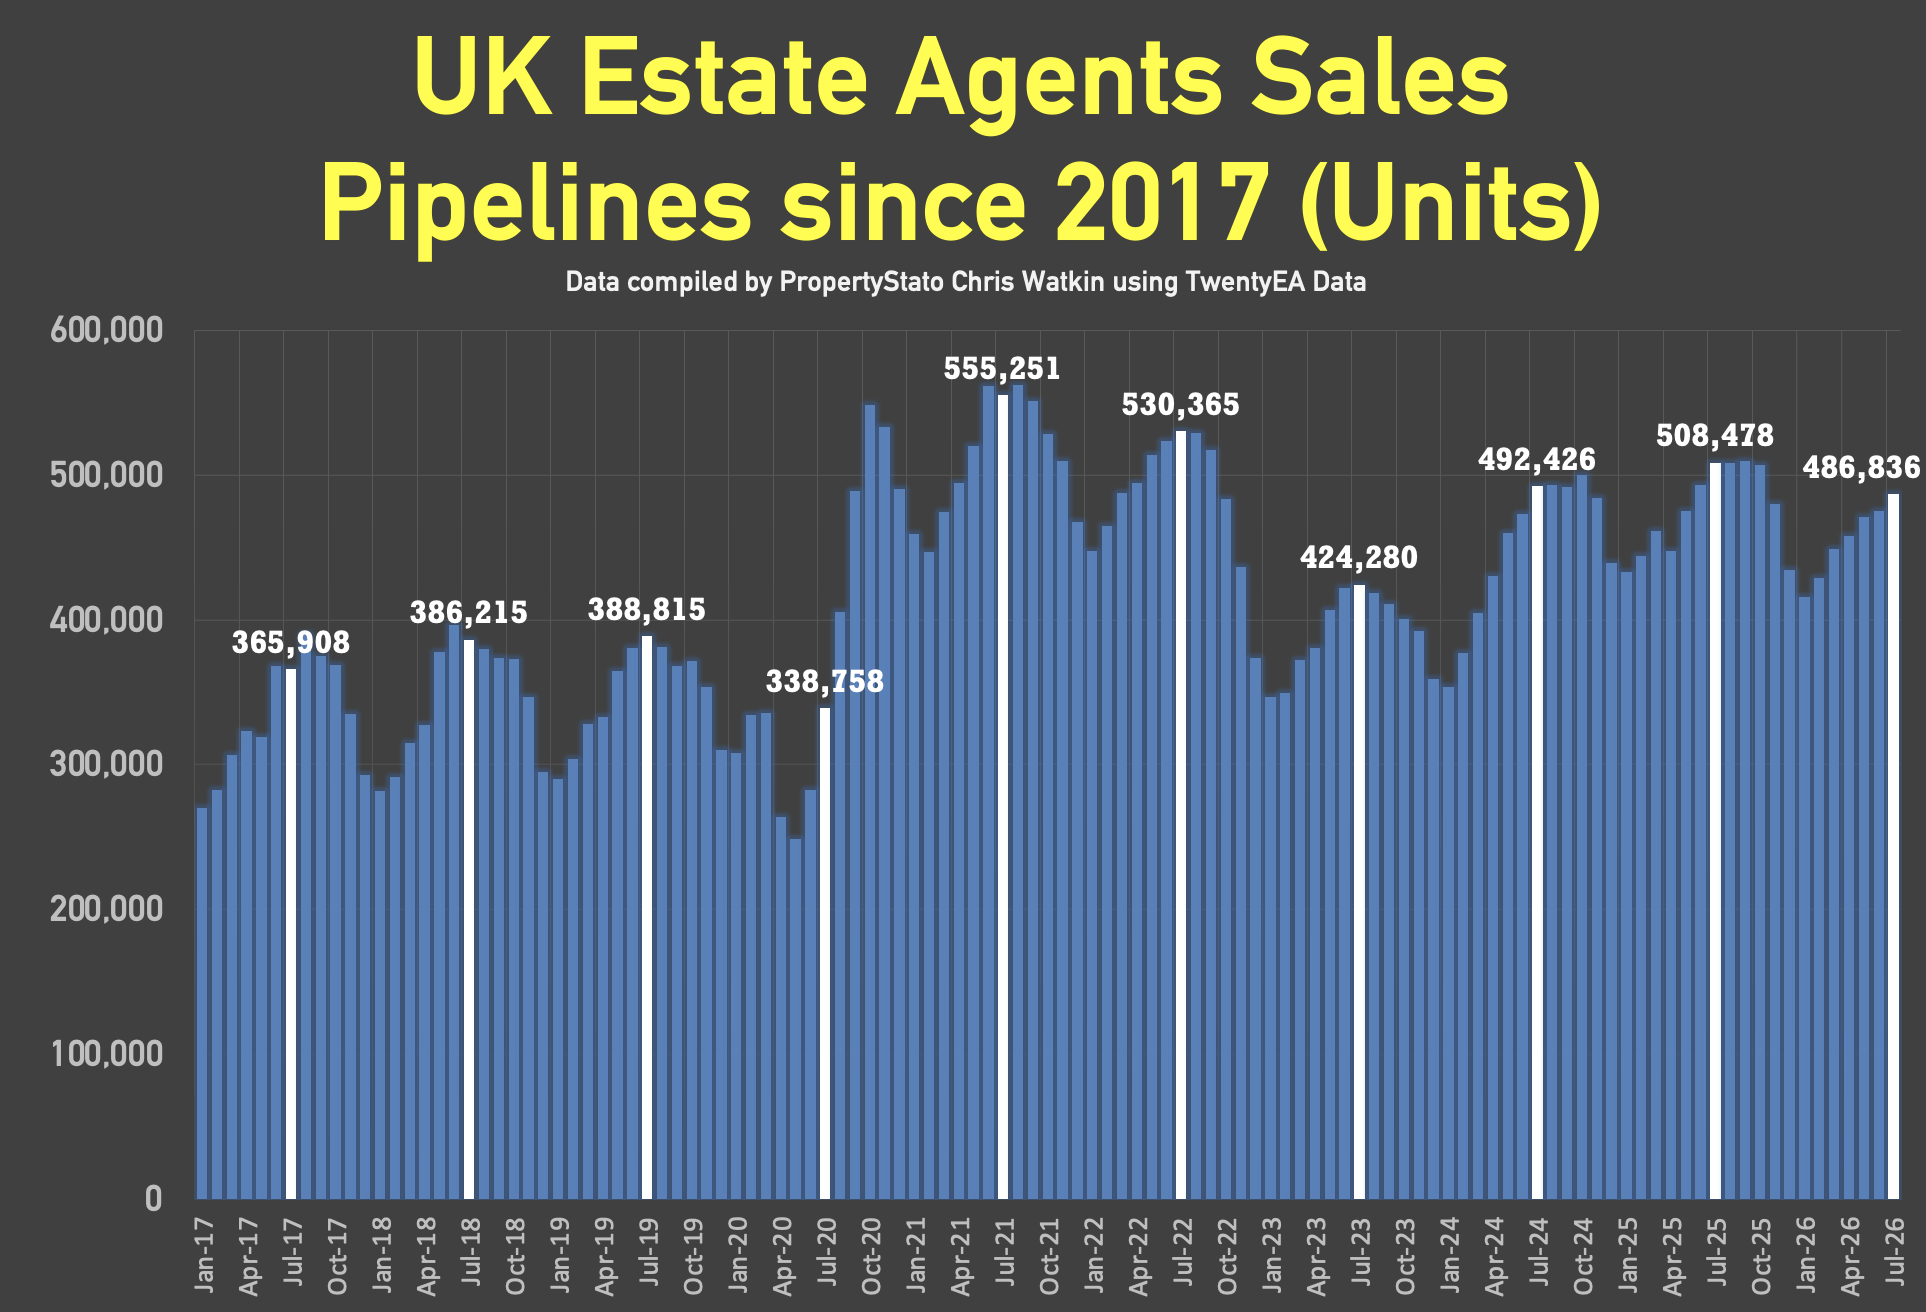
• 487k homes in agent’s sales pipeline on the 1st August 2026, lower than 12 months ago on 1st August ’25 (508k).
🟥 UK Rental Data
• Average Rent in Wk 33 – £1,770 pcm
• Average Rent in August 2026 – £1,788 pcm
• Average Rent in August 2025 – £1,800 pcm
• Average Rent in August 2021 – £1,394 pcm
• Average Rent in YTD 2026 – £1,765 pcm
• 323k UK Rental Stock available to rent in August 26 (319k in August 2025)
• New Rental Properties coming onto the market in August 2026 – 135,928. (128,821 in July 2025 & 111,080 in July 2022)
🟥 Local Focus this week in the Show
Oldham