

Market corrections often present chances to acquire quality assets at attractive valuations. Hence, “buy the dip” has long been a mantra for many investors. Historically, market pullbacks have offered attractive entry points for those willing to lean into volatility. However, following this April’s trade policy induced correction, those opportunities have been scarce. In what’s been characterized as a risk-on, high-beta market rally off the April lows, the brevity of such “dips” has stood out to investors and asset allocators. Here, we examine both the depth and duration of these dips.
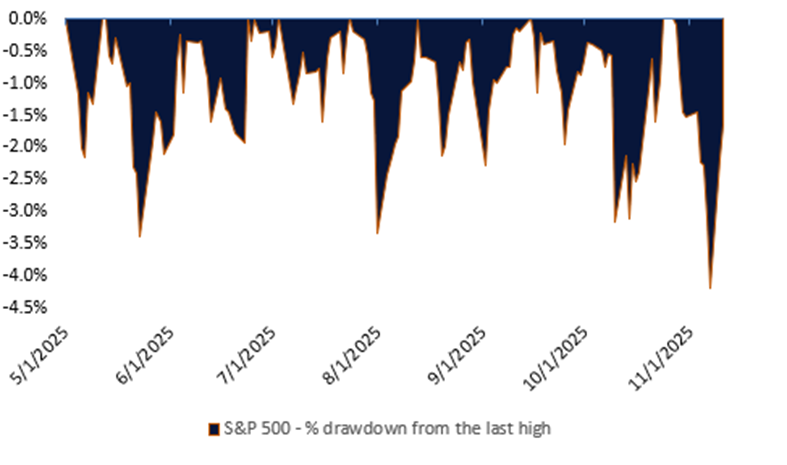
Since the end of April, the largest dip the S&P 500 has offered was just 4.2% off its all-time highs. Said differently, starting May 1, if an investor wanted to get the most optimal buying opportunity off the most recent highs, and was able to time the market perfectly, they’d only receive a 4.2% discount. Not only that, but that 4.2% opportunity only materialized last week, on November 7. If an investor had a buy limit order that was set to trigger at 5% below the last high, they’d still be holding cash. We’re using an index for the sake of this exercise, which of course can’t be invested in directly, but a passive ETF that tracks the index would yield a similar result. The magnitude and length (or lack thereof) of these instances when the index traded below the last high are highlighted in the “Shallow and Short “Dip Buying” Opportunities” chart.
Shallow and Short “Dip Buying” Opportunities
Source: LPL Financial, Bloomberg 11/11/25
Disclosures: Past performance is no guarantee of future results. All indexes are unmanaged and can’t be invested in directly.
Putting this into context, between 2020–2024, there were three occurrences of the S&P 500 being at least 10% below all-time highs. On average, during that time frame, when discount buying opportunities occurred, the average drawdown was 7.8%, but since April of this year that number has been 1.1%. So, if you were to pick days on which the market traded at a discount to the previous high, and through divine strokes of serendipity, happened to pick the lowest possible entry point on each of those days, you’d get just a 1.1% discount.
Not only has the depth of drawdowns been shallow since April, but the duration has been short-lived. New highs have been ubiquitous. The longest period during which the S&P 500 didn’t register a new high was just 10 trading sessions (as of market close on November 11, 2025), with the average length of drawdowns being just over 3.5 days. Yet, between 2020–2024, there were 14 instances where it took at least 10 sessions for the market to re-capture previous highs, and the average length of drawdowns was over 15 days.
Why Pullbacks Have Been Scarce
Resilient economic data, resilient earnings, easing trade tensions and abundant liquidity have fueled the almost relentless high-beta rally since “liberation day”. Investor sentiment remains risk-on, and technical momentum has amplified gains, leaving little room for prolonged drawdowns. Ironically, retail investor psychology of “dip buyers” may be helping to shorten the dips. Fear of missing out (FOMO) on gains keeps retail buyers engaged, and the quick rebounds condition these investors to “buy immediately,” shortening dips.
Conclusion
So, what can an investor do? The simple answer is to stay disciplined and remain invested with a thought-out approach to asset allocation. The pragmatists among us at this point would have concluded that minimal drawdown pain has meant attractive capital appreciation, if invested, which is exactly right. A regular investment regime may provide some dollar cost averaging opportunities and have a plan in place to execute a rebalance or asset allocation update when the opportunity arises.
***
Important Disclosures
This material is for general information only and is not intended to provide specific advice or recommendations for any individual. There is no assurance that the views or strategies discussed are suitable for all investors. To determine which investment(s) may be appropriate for you, please consult your financial professional prior to investing.