
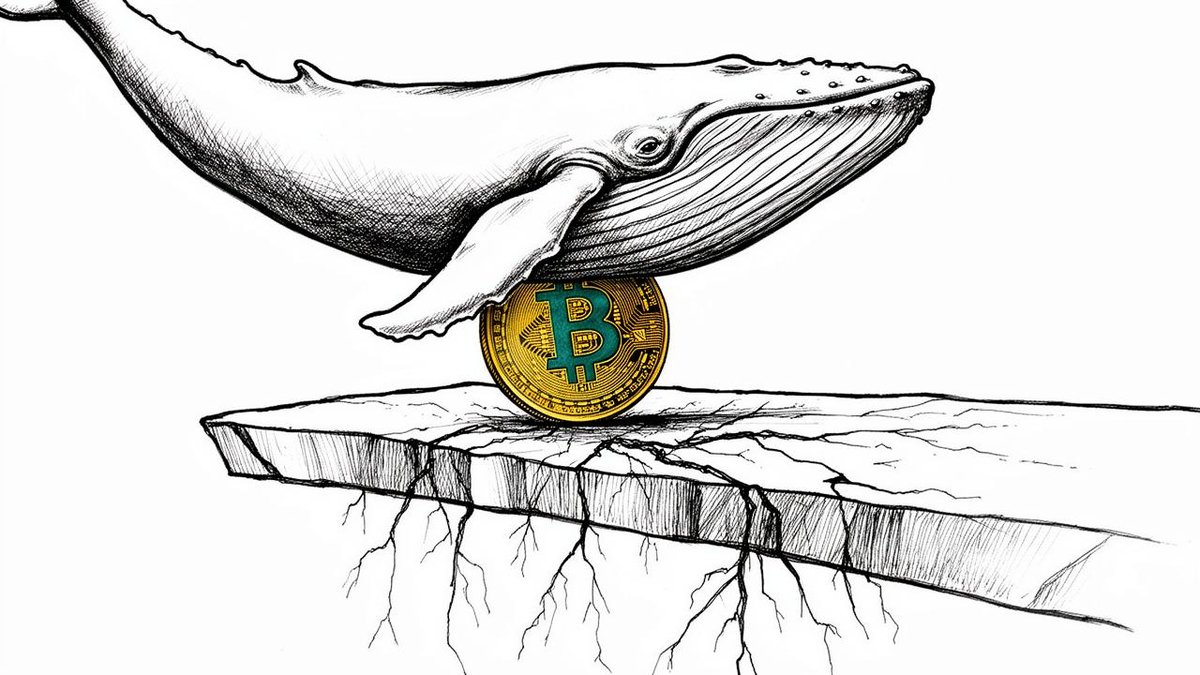
Bitcoin has dropped into a price band where roughly 1.22 million coins last changed hands, and the question now is whether that cluster of prior buyers can absorb the selling that has pushed the token below $70,000. Crypto analyst Ali Charts, in a post on X, identified a demand zone running from $63,111 to $64,373 and called it “one of the most significant support zones following the recent market correction.” The token was trading near $62,528 at the time of writing, according to SoSoValue data, meaning it has already slipped under the lower edge of that band.
The zone’s significance comes from Glassnode’s UTXO Realized Price Distribution, which maps where coins were last moved on-chain. A dense concentration of prior transactions at a given level often acts as a psychological and technical floor, because holders who bought there tend to defend the price rather than sell at a loss. Ali Charts argued that if the demand holds, there is “little significant resistance until $76,996,” leaving room for a sharp rebound.
The break below $70,000 came as traders priced in a greater chance of a Federal Reserve rate hike. More than $1.3 billion in leveraged positions were liquidated within 24 hours of the move. Bitcoin finished October near $77,400.
| Level | Price | What it represents |
|---|---|---|
| Demand zone | $63,111-$64,373 | ~1.22M BTC last traded here (Glassnode URPD) |
| Next resistance | $76,996 | Gap above the demand band, per Ali Charts |
| Short-term holder cost basis | ~$74,100 | Break-even for recent buyers (Glassnode) |
| August low band | $62,000-$66,000 | ~20% of short-term holder supply |
| June low | $58,500 | Next support below the band |
| Realized price | $53,700 | Average cost basis of all coins |
Note: Price levels are drawn from the cited on-chain analyses and reflect conditions as of Nov. 17-18.
Whales are still trimming exposure
The bullish read comes with a caveat from the same analyst. In a separate post on Nov. 16, Ali Charts cited Santiment data showing that large holders sold or redistributed 48,618 BTC, worth roughly $3.40 billion, over the preceding two weeks. He said whales continue to reduce exposure and that the distribution has not run its course. His earlier marker of $73,000, flagged in October as the level to watch if selling accelerated after the Nov. 3 midterm vote, has been left far behind.
A second on-chain report paints a similar picture of exhaustion without a clean bottom. Glassnode’s weekly market note, published Nov. 17, said realized losses have climbed to capitulation levels seen only near past troughs in 2018, 2020, 2022 and early 2023. The selling has been concentrated among holders with less than six months of tenure, who absorbed heavy losses early in 2026, took profits during the September-October rally and are now dumping coins at a loss again. Leverage has been flushed out, the firm said, but demand remains thin: stablecoin supply is shrinking, miners are selling and exchange-traded funds are seeing outflows.
Glassnode put the key support at $62,000 to $66,000, around August’s lows, where about a fifth of short-term holder supply was acquired. A daily close below $62,000 would be a serious risk, the firm warned, because there is little short-term-holder buying beneath that level and a cluster of forced long liquidations sits just below it. Further down, it identified $58,500, the June low, and $53,700, the realized price that represents the average cost basis of all bitcoin in circulation. On the upside, the short-term holder cost basis of $74,100 is the break-even line for recent buyers.
Coinbase Premium, a gauge of whether U.S. buyers are paying more or less than offshore venues, had been mostly negative since late October. It flipped positive over the weekend as American buyers paid up near the lows, peaked on the night of Nov. 15, then slipped back to a slight discount. A sustained return to premium would signal that U.S. demand is genuinely back, Glassnode said.
What traders are watching
Options pricing on Deribit assigns roughly a one-in-three probability that bitcoin trades below the $53,700 realized price by September 2027, and about a 20% chance it exceeds September’s high. The firm also flagged a heavy macro calendar that could reprice volatility: Nvidia’s quarterly results released Nov. 17, Anthropic’s planned Nasdaq listing on Nov. 19, the Fed’s rate decision on Dec. 9 and November CPI the following day.
For now, the $63,111 to $64,373 band is the line in the sand. Holding it keeps $76,996 in play; continued whale distribution would put it to the test.