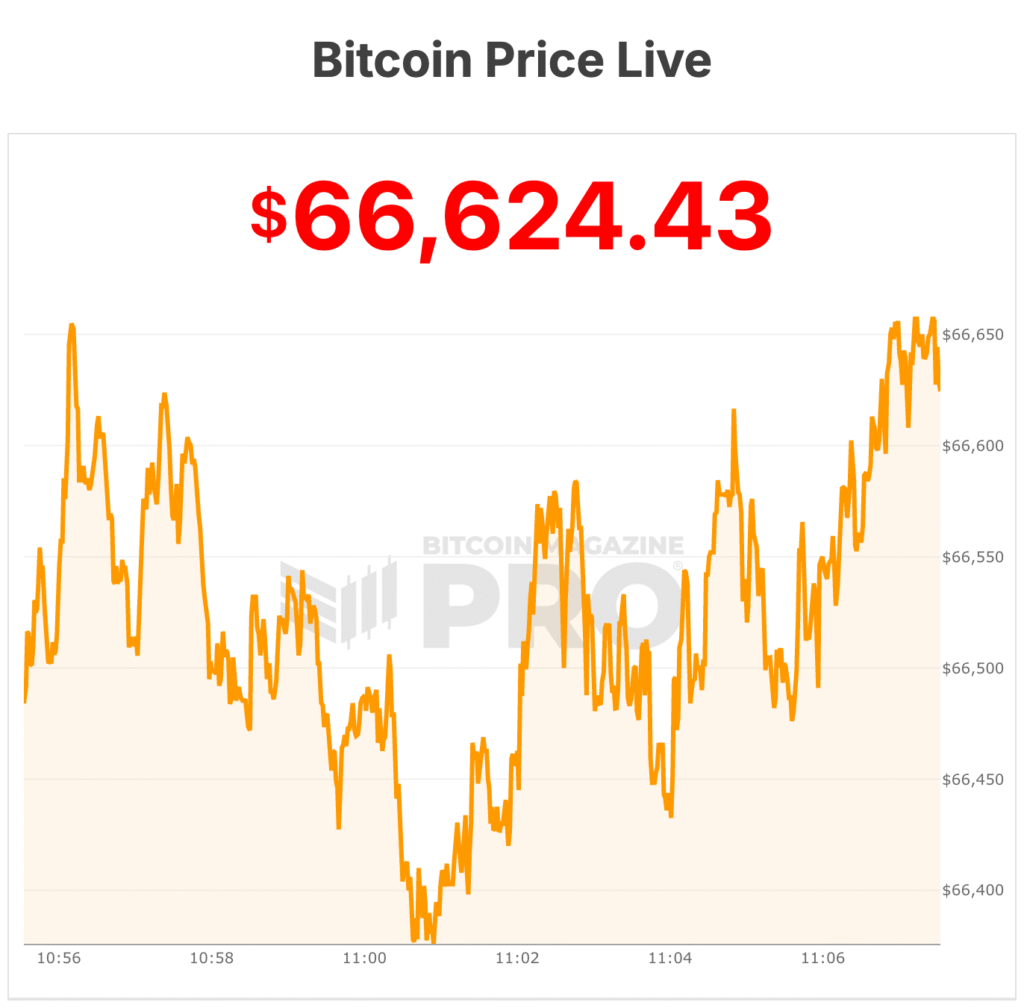
The bitcoin price extended its steep decline today after a multi-month long slide that erased more than half of its value from its October peak, with the bitcoin price now trading near $66,000 following a sharp sell-off that pushed prices toward $60,000.
Since roughly December 2025, the bitcoin price has followed a pretty straightforward downward trajectory, falling from levels above $100,000 into a volatile range that has kept traders focused on whether the market has reached a durable floor.
Bitcoin price dropped below the psychological mark of $70,000 on Feb. 5, triggering intense selling pressure across spot and derivatives markets. The decline has been driven by macroeconomic uncertainty, institutional derisking, and turbulence in technology stocks that often trade in tandem with crypto risk appetite.
Since the sell-off, Bitcoin price has struggled to regain momentum, hovering around the $66,000 to $67,000 level while trading swings between $66,000 and $72,000 remain common.
K33: Bitcoin price may be at a ‘local bottom’
Research and brokerage firm K33 argued this week that the plunge toward $60,000 may have marked a local bottom, citing what it described as “capitulation-like conditions” across volume, funding rates, options skews, and exchange-traded fund flows.
K33 Head of Research Vetle Lunde pointed to a “vast list of extreme outliers” that accompanied the move, according to reporting from The Block. Trade volumes reached the 95th percentile, while funding rates collapsed to levels last seen during the March 2023 U.S. banking crisis. Options skews rose to readings previously associated with the most intense stress of the 2022 bear market.
Momentum indicators also entered rare territory. After persistent selling since Jan. 20, Bitcoin’s daily Relative Strength Index fell to 15.9, one of the most oversold readings since 2015. RSI measures the speed and magnitude of recent price changes on a scale from 0 to 100, with values below 30 often viewed as oversold.
Lunde noted that previous extremes in March 2020 and November 2018 coincided with major cycle lows.
Sentiment gauges reflected similar strain. The Crypto Fear & Greed Index fell to 6 during the sell-off, its second-lowest level on record, underscoring the depth of pessimism as Bitcoin price approached $60,000.
The price action came with what Lunde called “hyperactive trading.” Two-day spot volume reached $32 billion on Feb. 6, among the highest ever recorded. Feb. 5 and Feb. 6 marked back-to-back 95th percentile volume sessions, a pattern seen only once in the past five years during the FTX collapse.
K33 said such outlier days often align with local price extremes, though consolidation and retests can follow.
Derivatives markets mirrored the stress. Daily annualized funding rates in Bitcoin perpetual swaps fell to -15.46% on Feb. 6, the lowest since March 2023, while the seven-day average annualized funding rate dropped to -3.5%, its weakest since September 2024.
Options positioning moved into what Lunde described as “extreme defensive territory,” similar to periods surrounding the Luna collapse, the 3AC unwind, and the FTX failure.
ETF activity also surged. BlackRock’s iShares Bitcoin Trust (IBIT) recorded its largest daily trading volume on Feb. 5, surpassing $10 billion with 284.4 million shares traded. The same day ranked as the fifth-largest daily outflow since spot Bitcoin ETFs launched, contributing to net weekly outflows of 13,670 BTC despite inflows later in the week.
Taken together, K33 said the breadth of volatility, volume, yields, skews, and ETF flows supports $60,000 as a high-probability bottom. The firm expects the Bitcoin price to enter a prolonged consolidation phase lasting weeks or months, likely between $60,000 and $75,000, with elevated odds of a retest of support but limited expectation of further downside.
Bitcoin billionaires are buying the dip
Some long-term industry figures have framed the downturn as an opportunity. Val Vavilov, co-founder of Bitfury and an early cryptocurrency adopter, said the latest market rout offered a chance to rebalance and add exposure.
“For us, the fall in Bitcoin is an opportunity to rebalance our portfolio and purchase a certain amount of Bitcoin at a low price,” he said according to Bloomberg, while noting Bitcoin remains only one component of a broader strategy that now includes artificial intelligence data centers.
Technical analysts remain focused on key levels. After the rebound from $60,000, resistance sits near $71,800, with $74,500 representing a Fibonacci retracement level.
Further resistance stands near $79,000 and $84,000.
On the downside, bulls are watching $65,650 and $63,000 as nearer-term support, while $60,000 remains the major floor above the 0.618 Fibonacci retracement at $57,800, according to Bitcoin Magazine Pro data.
At the time of writing, the bitcoin price is $66,624.