

The people selling bitcoin at a loss this weekend mostly bought it just two months ago. Bitcoin slid below $63,000 late on Saturday, November 14, 2026, touching about $62,500 on Coinbase, its lowest price since mid-August, and on-chain analyst James Check called it the “fourth capitulation event since the all-time high.” If you’re new to this, capitulation is when investors give up and sell at a loss, often in a rush, and it tends to show up near the end of big declines rather than the start. Here’s who’s selling, who isn’t, and what the data can and can’t tell you about what comes next.

Binance Referral Code
$100 Sign-Up Bonus
20% Lifetime Discount on Trading Fees
Code Valid: November 2026
BINANCEMB
What “Capitulation” Means, in Plain English
When a bitcoin moves at a lower price than it last moved at, the gap is a realized loss: the loss becomes real instead of just “on paper.” Analysts add up those losses across the network each day. A capitulation event is a spike in them, a sign that many people are selling below what they paid because they’ve run out of patience, money or nerve.
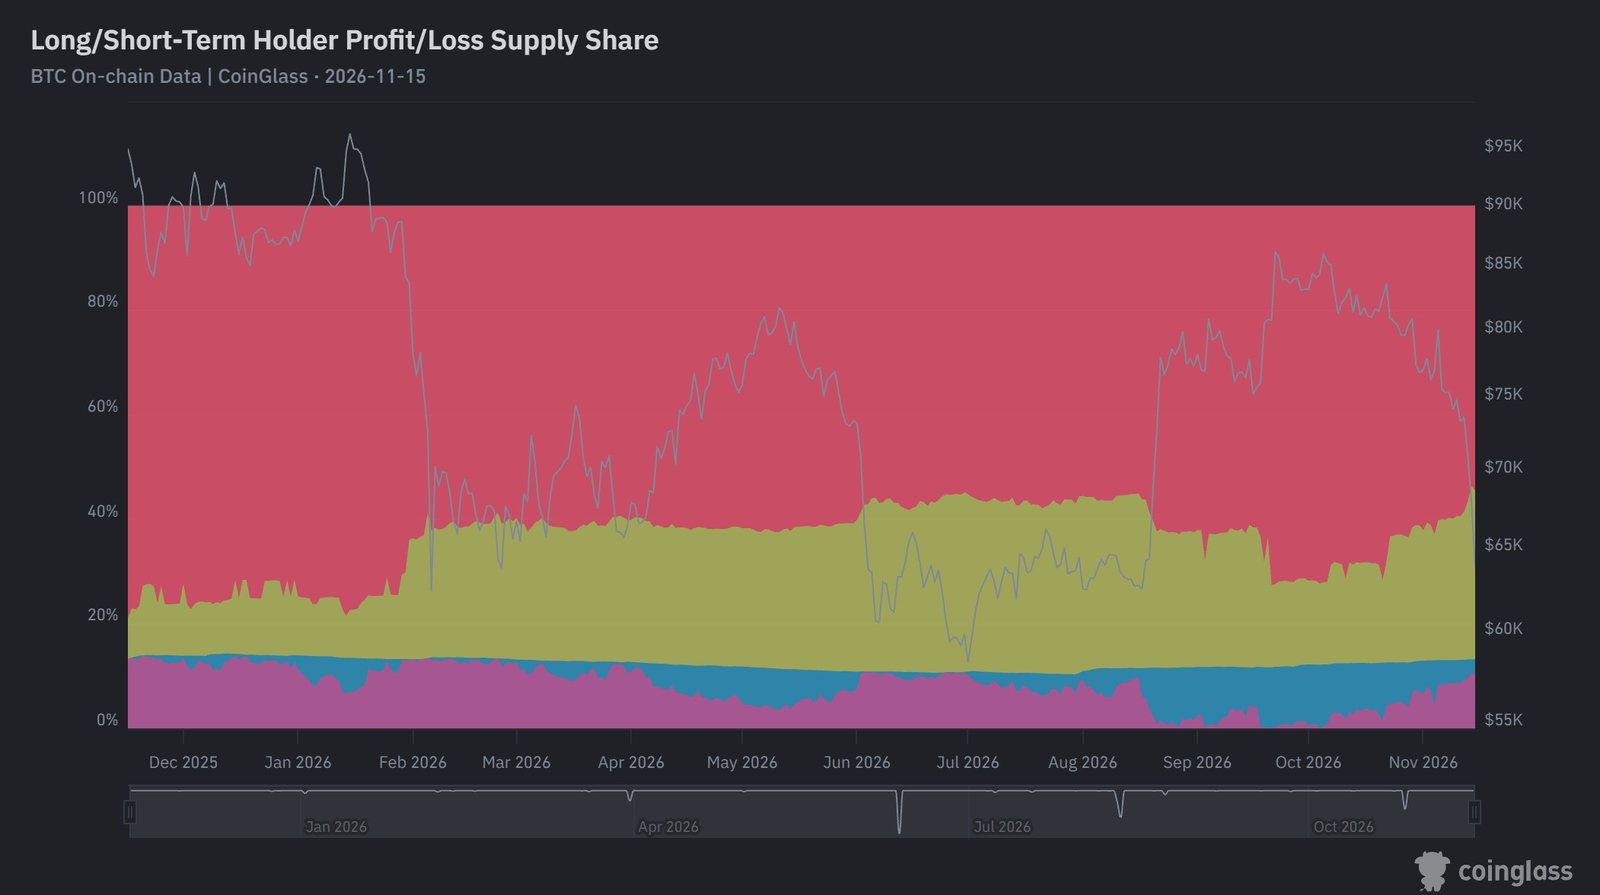
Analysts also split holders into two groups:
- Short-term holders (STHs): wallets that have held their coins for less than about 155 days. They tend to sell when prices fall.
- Long-term holders (LTHs): wallets that have held longer. They tend to sit through drops.
Which group is selling tells you a lot about whether a drop is panic from newcomers or a real exit by long-time believers.
The Four Waves Since Bitcoin’s Record High
Bitcoin peaked above $126,000 in October 2025. Check hasn’t published dates for each of the four events he counts, so the table below is our own reading of the major loss-selling episodes since then, based on on-chain reports at the time.
| Wave | When | What happened |
| 1 | Mid-to-late November 2025 | Bitcoin broke below $100,000; recent buyers sold about 148,000 BTC at a loss in one day, according to an on-chain analyst |
| 2 | Early February 2026 | Bitcoin dropped to about $59,000, a 15-month low, liquidating more than $1.1 billion in bullish bets |
| 3 | Late June to July 1, 2026 | About 50,000 BTC moved to exchanges at a loss in a day; bitcoin set its 2026 low of $57,742 on July 1 |
| 4 | November 2026 | Realized losses doubled from $420 million to over $850 million a day; bitcoin hit about $62,500 |
Waves 1–3 are our reconstruction, not Check’s published list. Treat the matching as an informed estimate.
Two things stand out. First, each wave has struck at a lower or similar price, so bitcoin has been grinding sideways to down for over a year. Second, the 2026 low of $57,742 from July still hasn’t broken, which is why traders are watching the high-$50,000s closely.
Who’s Selling: The September Crowd
Check’s breakdown is blunt. In a post on X on November 14, he said most of the people “taking the L” are short-term holders who didn’t buy enough near $67,000 in July and August, then bought too much above $80,000, and are now selling at the very price they once passed up.

The data backs up that picture:
- Over 85% of this week’s realized losses come from short-term holders who bought in the high $80,000s, according to Check.
- On November 10, short-term holders sent about 47,000 BTC to exchanges at a loss, worth about $3.4 billion at that day’s low, by our math. Only about 1,700 BTC arrived at a profit, roughly 27 coins at a loss for every one in profit, according to CryptoQuant data.
- Short-term holders’ average purchase price, their cost basis, sits near $75,700, according to CryptoQuant. At $62,500, the average recent buyer is about 17% underwater, by our math.
This looks like a buyer’s-remorse wave, not a mass exit. People who bought on September’s rally are cutting losses after watching bitcoin fall about 26% from its late-October high of about $84,856.
Who Isn’t Selling: Long-Term Holders
Here’s the other half of Check’s message. He said long-term holders sitting on profits are “by and large doing absolutely nothing,” and if bitcoin were truly finished, they would be the ones heading for the exit.
That matters because when long-term holders sell into a decline, a correction can turn into a long bear market. When they hold while newer buyers dump, coins move from shaky hands to patient ones, the pattern analysts look for near bottoms. It isn’t a guarantee, but it’s why Check calls this a capitulation rather than the start of something worse.
Leverage Made the Drop Faster
Saturday’s slide wasn’t only about people selling coins they owned. It also flushed out leveraged traders, people who borrow money to bet bigger on price moves. If the price moves against them, exchanges automatically close their positions, a process called liquidation.
In the 24 hours to Saturday evening, about 319,000 traders were liquidated across crypto, totaling about $1.96 billion, according to data compiled by CoinGlass:
| Liquidations (24 hours) | Long bets (price up) | Short bets (price down) | Share that were longs |
| Bitcoin | ~$645M | ~$62M | ~91% |
| Ether | ~$432M | ~$40M | ~92% |
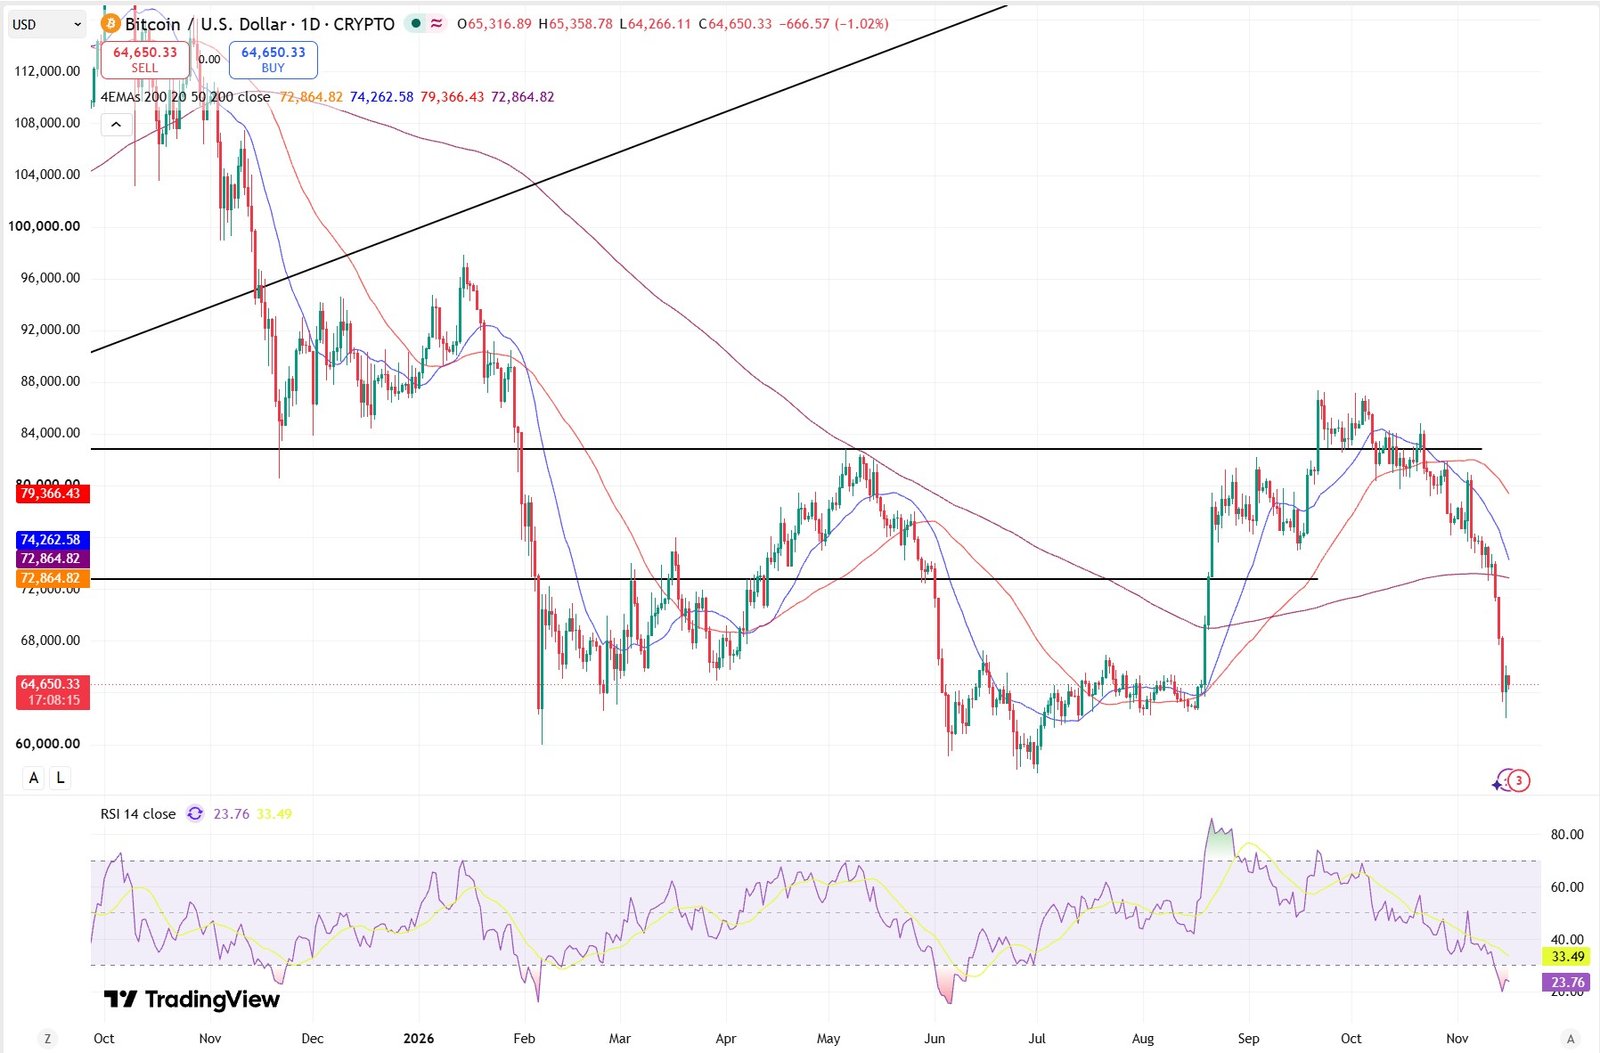
When long bets get closed, exchanges sell bitcoin to cover them, which pushes the price down further and triggers more liquidations. That chain reaction is why the drop sped up after bitcoin broke its 200-day moving average near $73,000, a widely watched trend line. If you’re not sure how leverage works, it’s worth reading up on how leverage trading in crypto works before you ever try it.
Why the Selling Started in the First Place
Capitulation is the final stage of a decline, not its cause. Bitcoin has fallen about 25% since October 21, and several pressures have stacked up over those three and a half weeks:
- ETF money kept leaving. Spot bitcoin ETFs, stock-market funds that hold real bitcoin, saw about $1.91 billion in net outflows over seven straight trading days from November 5 to November 13, and almost $3 billion from October 30 through November 13. That’s about $273 million a day during the streak, by our math. The funds don’t trade on weekends, so Saturday’s drop happened without them.
- Interest rates. Markets still expect U.S. rates to stay high and possibly rise again, which makes assets that pay no interest, like bitcoin, less attractive.
- The Binance hack. The record $6.3 billion theft from Binance on October 29 has kept nerves raw, even though Binance has covered users’ losses and the US is moving to seize part of the stolen funds.
- Risk-off mood. A cautious mood around AI stocks has spilled into other risky assets, and bitcoin has often traded alongside tech shares this year.
Ether fell about 22% over the same week, more than bitcoin’s roughly 17%, which is typical. Smaller coins usually fall harder when investors pull back.
The “Deep Value” Claim, Decoded
Check also said bitcoin has entered what he calls the “deep value zone.” In a separate post, he explained the measure behind it: his Mean Reversion Index sits at Q18, meaning today’s reading is in the bottom 18% of its historical range. He treats anything below Q20 as deep value.
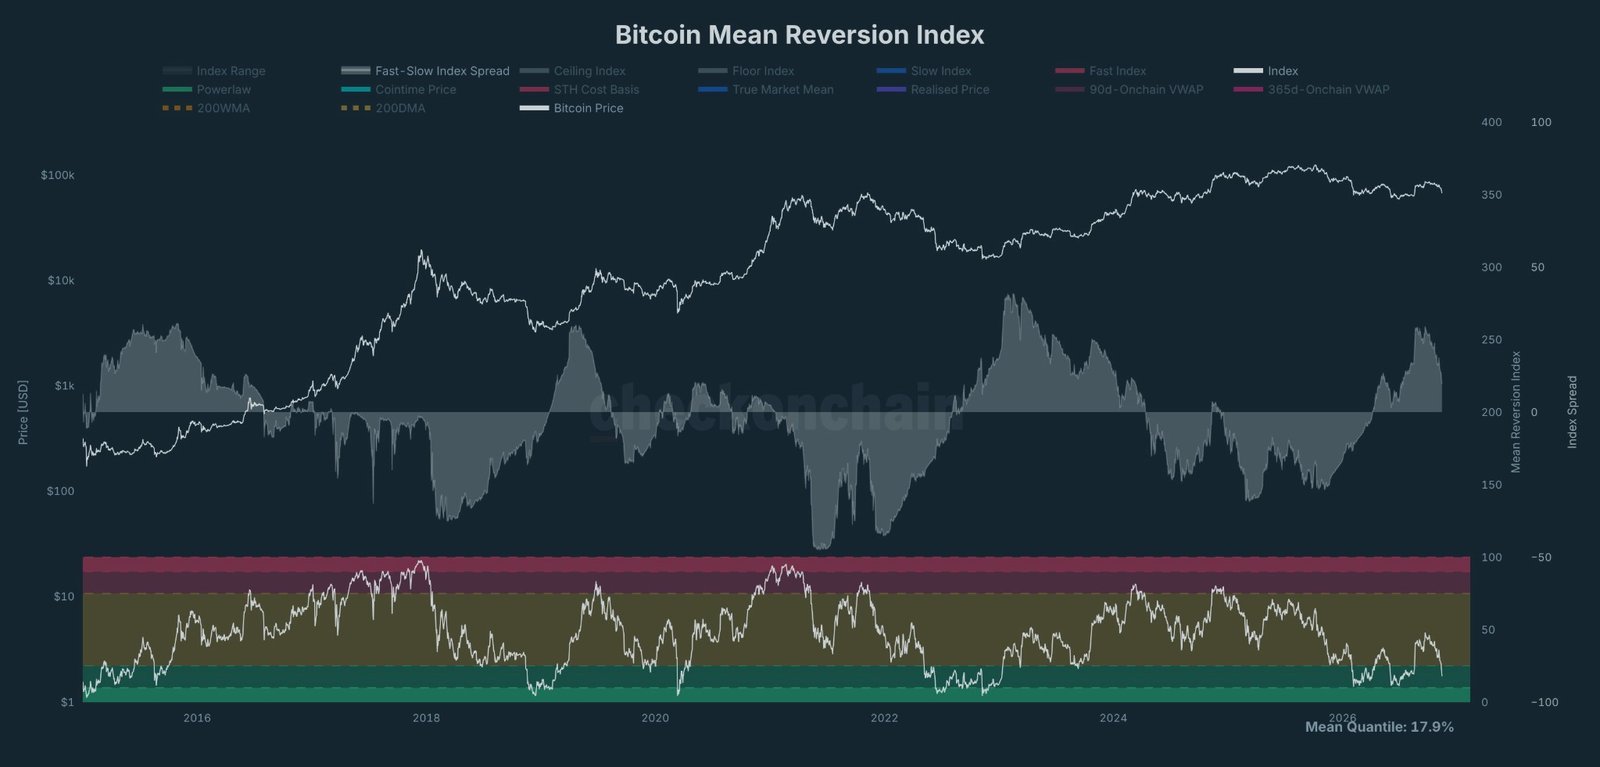
In plain terms, the index compares bitcoin’s price to where it has tended to trade over time. A low reading means the price is unusually far below that typical level. Check said bitcoin was last in this zone in February 2026, late June 2026, and before that in late 2022, during the crypto winter after the FTX collapse.
What it doesn’t mean: Check himself said it doesn’t mean the bottom is in. It means that, historically, people who started buying in small amounts in this zone ended up in profit eventually, not necessarily quickly.
After the most recent visit, bitcoin climbed from its July 1 low of $57,742 to about $87,200 in September, a gain of about 51%, by our math. That rally is exactly what drew in the buyers who are now selling. Past rebounds don’t promise a future one.
The Price Levels Traders Are Talking About
These are reference points from analysts and traders, not predictions:
| Level | Why it comes up |
| ~$75,700 | Short-term holders’ average cost basis (CryptoQuant) |
| ~$73,000 | 200-day moving average, broken during the slide |
| ~$68,000 | 200-week moving average, a long-term trend line also broken |
| ~62,000–62,500 | This weekend’s low |
| $57,742 | 2026 low, set July 1 |
| ~$57,000 | Level one analyst, Michaël van de Poppe, calls his bear-market floor |
A moving average smooths out price over a set number of days or weeks, so traders use it to judge the trend. Bitcoin now sits about 8% above its 2026 low and about 50% below its record high, by our math.
Capitulation waves feel like the end of the world while they’re happening. On-chain data says this one is mostly recent buyers walking away, while long-term holders stay put. That’s a better sign than the price chart alone suggests, but it doesn’t tell you when, or from what price, bitcoin turns around.
Prices and market data are as of November 14–15, 2026, and can change quickly. This article is for information only and is not financial advice.
FAQs
What was crypto’s biggest single-day crash in recent years?
On October 10, 2025, about $19 billion in leveraged bets were wiped out in a single day, the largest liquidation event on record. A year later, bitcoin’s safety net is back, but altcoins are still on a tightrope.
Are companies like Strategy still buying bitcoin?
Yes, but in much smaller amounts than before. Strategy’s bitcoin purchases have shrunk, and big corporate buyers have been a less reliable source of demand this year.
What is a hardware wallet?
It’s a small device that stores your crypto keys offline, so hackers can’t reach them over the internet. You still control your coins without trusting an exchange.
Do interest rates really affect bitcoin’s price?
Often, yes. When safe assets like government bonds pay more, some investors move money out of riskier ones.
What’s the difference between a correction and a bear market?
A correction usually means a drop of about 10% to 20% from a recent high. A bear market typically means a fall of 20% or more that lasts for months. Bitcoin is down about half from its October 2025 peak, which most analysts would call a bear market.