

The S&P 500 has taken investors on a wild ride over the past few months. The index fluctuated between gains and losses amid turmoil in Iran, and as investors worried about the future revenue potential of artificial intelligence (AI) companies. In recent days, though, these risks have attenuated, prompting the index to soar. The S&P 500 rebounded and even reached new highs — the index is now heading for a gain of more than 3% for the year.
A ceasefire in Iran has increased optimism that a resolution will be reached, and positive comments from AI companies have brought these stocks back into the spotlight.
Still, as the new earnings season unfolds, investors are wondering whether this positive momentum will last or whether the uncertain mood that reigned just a few weeks ago will return. We can turn to a recent stock market movement for some clues. The market recently did something that’s been witnessed only once before in 154 years, and history is very clear about what happens next.

Image source: Getty Images.
What’s driven stock market gains
Before diving in, it’s key to take a look at what’s driven the stock market over the past few years — and what’s represented a risk. As mentioned, AI companies set the pace for the benchmark, with giants such as Nvidia, Alphabet, and Palantir Technologies soaring.
These players have been delivering explosive growth thanks to their strengths in AI — customers have rushed to them for AI products and services since this technology has the potential to drive efficiency and innovation. Investors, seeing this potential, have scooped up shares of companies developing and selling AI as well as companies that may benefit from applying AI to their businesses.

Today’s Change
(0.80%) $56.68
Current Price
$7165.08
Key Data Points
Day’s Range
$7112.82 – $7168.59
52wk Range
$5433.24 – $7168.59
Volume
3.2B
All of this helped AI stocks to surge, and since many of these players are big tech companies that are heavily weighted in the S&P 500, the benchmark also advanced.
The only problem is that, as a result of this run-up, many stocks reached peak valuations. In fact, the entire index found itself in expensive territory — and the risk was that these levels were not sustainable. This brings me to the stock market’s recent move. Earlier this year, stocks reached a valuation level only seen once before over more than 150 years — the last time was during the dot-com bubble about 26 years ago.
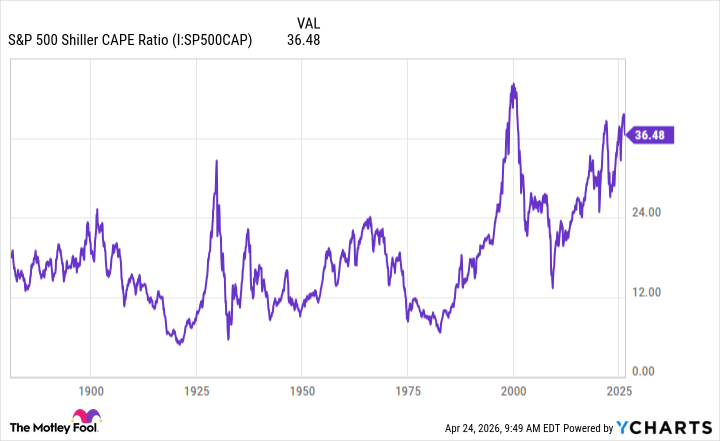
S&P 500 Shiller CAPE Ratio data by YCharts
A look at valuation
We can see this through the S&P 500 Shiller CAPE ratio, which measures stock price and earnings per share over a 10-year period. This allows for fluctuations in the economy, so it presents a pretty accurate picture of a company’s valuation.
The Shiller CAPE ratio peaked in February, and since that time, as stocks slid, valuation has also declined.
That said, valuation remains close to these highest levels, so in spite of the declines in stocks in the first quarter, overall, the market remains expensive.
Now, let’s consider what history tells us about the future. A look at the past decade of valuation and stock market performance shows us that every time stocks have dropped from a valuation peak, the market has gone on to gain.
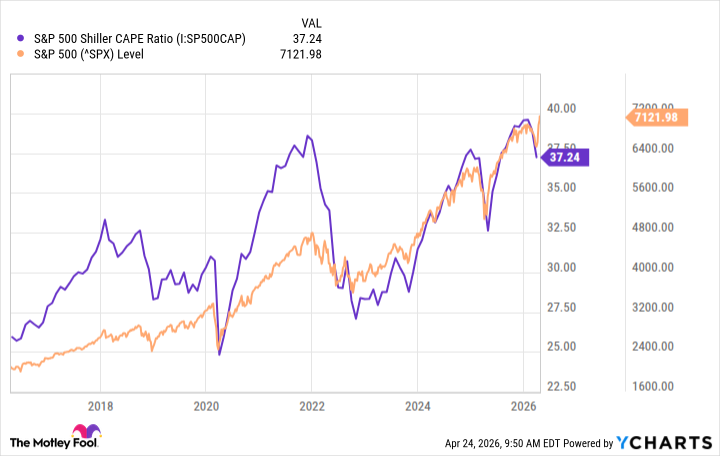
S&P 500 Shiller CAPE Ratio data by YCharts
And these periods of positive momentum have often lasted a couple of years. So history is very clear: As prices become more reasonable, investors scoop up stocks, and the S&P 500 generally enters a new phase of growth.
Does this mean that the increase we’re seeing now could be the start of this trend? Possibly. But there’s one key element to keep in mind, and this is something that could either drag the index down or limit gains. Though valuation has started to decline, as I said above, stocks today remain much pricier than the average over time — and pricier than they were following the 2000 valuation peak. So, investors may pick up bargains here and there, but today’s overall high valuation level may stop them from rushing to buy stocks hand over fist.
Regardless of the market’s next move, here’s some fantastic news for you right now: History shows us that over time, the S&P 500 always has climbed. And that means the best strategy is to selectively pick up quality stocks when the price is right — you’ll find these opportunities during any market environment — and hold on for the long term.