

Last week, the iconic Dow Jones Industrial Average (^DJI +0.28%) and broad-based S&P 500 (^GSPC +0.62%) soared to fresh all-time highs. Meanwhile, the innovation-inspired Nasdaq Composite (^IXIC +1.30%) reached uncharted territory in early June.
These all-time highs have been achieved despite mounting headwinds on Wall Street. Specifically, equities have launched to new highs with the Iran war still ongoing and trailing 12-month inflation clocking in well above the Federal Reserve’s long-term target of 2%.
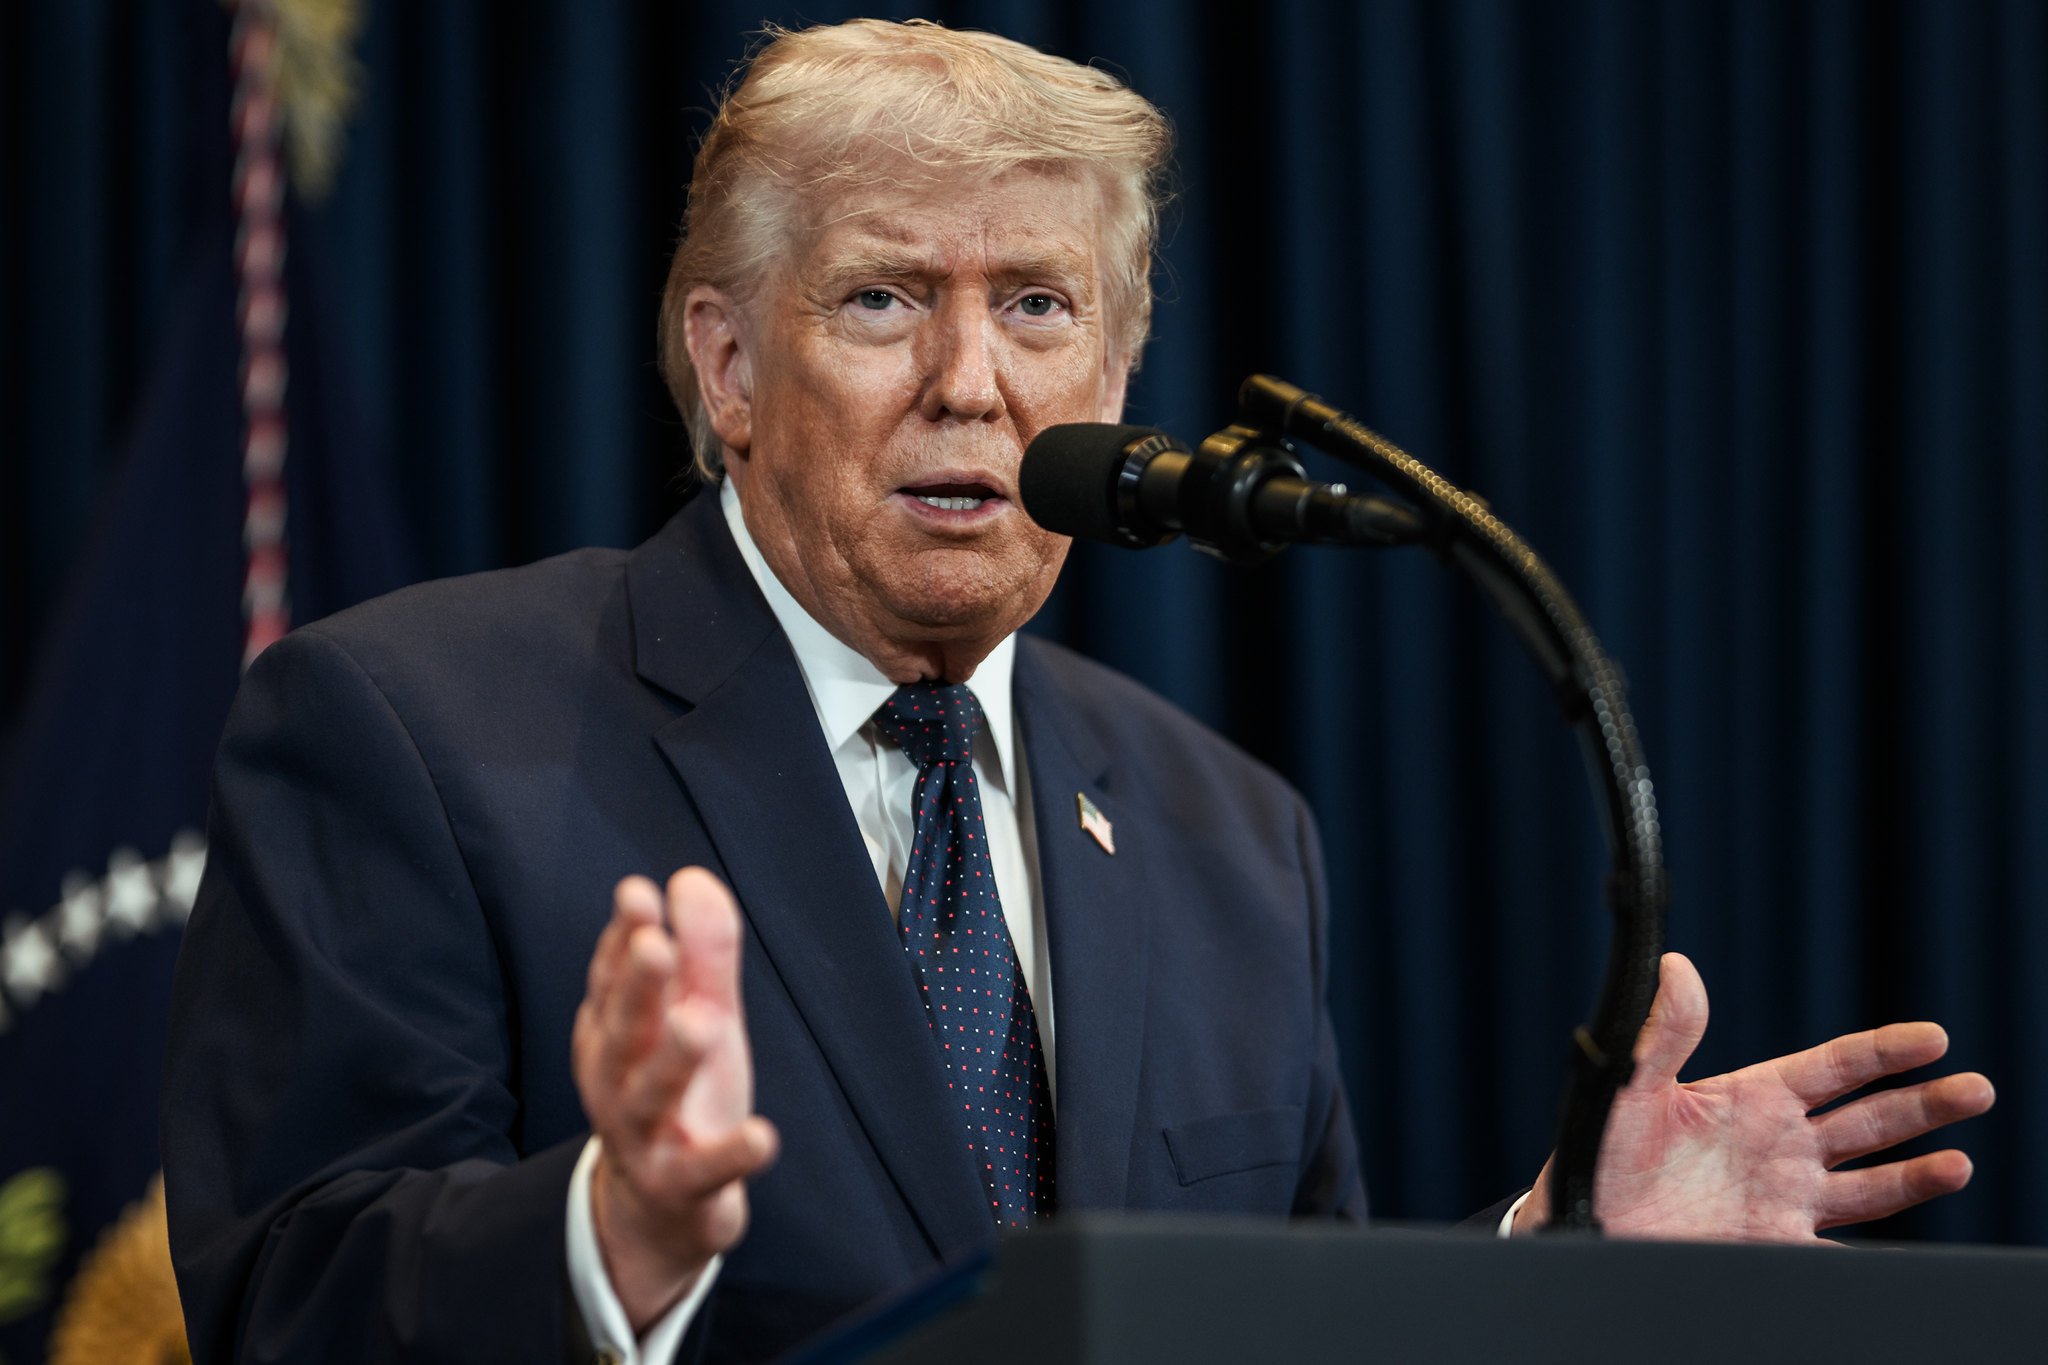
The Trump-led Iran war is complicating things for Wall Street. Image source: Official White House Photo by Daniel Torok.
Back in May, while speaking to the press about the Iran war in the Oval Office, President Donald Trump stated:
We just hit a new high in the stock market. The stock market’s the highest it’s ever been. And I expected that the market would be down 20% to 25%.
While the stock market has, thus far, successfully shrugged off Iran war concerns, several factors point to President Trump’s downside prognostication for equities coming to fruition in the not-too-distant future.
The Iran war’s inflationary concerns may force the Fed into action
Although war has an incalculable cost for the people directly impacted by it, the primary concern for Wall Street is the effects the Iran war can have on U.S. inflation.
Not long after Trump gave the OK for the U.S. military to attack Iran on Feb. 28, the latter shut down the Strait of Hormuz to most commercial vessels. With few exceptions, this closure has been in place for more than five months, and it’s effectively halted the daily flow of a fifth of the world’s petroleum liquids.
The most immediate impact of the Iran war has been felt at the fuel pump. Removing a fifth of the world’s crude oil supply sent energy prices, and thus prices at the pump, soaring. Even with crude oil prices notably below their Iran war peak, gas and diesel prices remain elevated, relative to where they were when the Iran war began. The longer the Strait of Hormuz remains closed to most maritime traffic, the longer it’ll take to return fuel prices to pre-war levels.
64.
As in 64 consecutive months with US core inflation above the Fed’s 2% target.
The Fed has lost all credibility when it comes to fighting inflation.
Kevin Warsh talks a big game, but talk is cheap. The Fed should have hiked rates yesterday and ended QE. pic.twitter.com/HvimqfW6WW
— Charlie Bilello (@charliebilello) July 30, 2026
But this isn’t just an energy supply issue anymore. The price stickiness of Core Personal Consumption Expenditures (PCE), which excludes volatile food and energy costs, indicates that Iran-war-based inflation is impacting the broader economy. Even though headline inflation has eased a bit since peaking at a three-year high of 4.2% in May, Core PCE is essentially stagnant at 3.3% to 3.4%.
Fed Chair Kevin Warsh has been adamant that he and his colleagues at the Federal Open Market Committee (FOMC) will “deliver price stability.” At the latest FOMC meeting on July 28-29, three voting members dissented in favor of a quarter-point rate hike. It’s the first time that a Fed chair has been challenged with three dissents so early in their tenure in 56 years! It’s also a pretty clear indication that Federal Reserve policymakers are ready to jump into action to stabilize prices.
Under normal circumstances, FOMC rate hikes aren’t market-crushing events. In fact, rate hikes have historically coincided with strong economic growth and a rising stock market.
However, this arguably isn’t “normal circumstances.” The Dow Jones Industrial Average, S&P 500, and Nasdaq Composite are catapulting higher on the heels of the artificial intelligence (AI) data center build-out. While some of America’s most influential businesses are using cash on hand to finance this expansion, debt is an important tool for the AI infrastructure build-out.
If the Fed hikes interest rates, any slowdown in AI stock growth rates, or even so much as a rerating of the stock market’s historically pricey valuation multiples, could send Wall Street over the edge.

Image source: Getty Images.
The Iran war threatens to put stock market valuations under a microscope
But it’s not just inflationary concerns that could make Trump’s prophecy of a 20% to 25% stock market slump a reality.
When stock market headwinds arise, such as geopolitical concerns, it tends to place added emphasis on the nuts and bolts of what makes public companies tick. In other words, fundamentals come into focus, which often leads to stock valuations being placed under a microscope.
Historical events can’t guarantee that something will happen on Wall Street. But more often than not, history can accurately foreshadow directional movements in the Dow Jones Industrial Average, S&P 500, and Nasdaq Composite.
Before President Trump green-lit the start of the Iran war in late February, the stock market entered 2026 at its second-priciest valuation in history. The S&P 500’s Shiller Price-to-Earnings (P/E) Ratio, which is also known as the Cyclically Adjusted P/E Ratio, or CAPE Ratio, nearly reached a multiple of 43 in early June. For context, the average Shiller P/E Ratio since January 1871 is 17.4, and the only higher reading over the last 155 years was 44.19 (December 1999), in the lead-up to the bursting of the dot-com bubble.
Stock Market Shiller PE Ratio on the verge of taking out its Dot Com Bubble all-time high 🚨 🤯 👀 pic.twitter.com/CtCmSgWnLt
— Barchart (@Barchart) July 11, 2026
The CAPE Ratio has exceeded 30 on just six occasions throughout history, including the present. The previous five instances were all eventually followed by declines of 20% or substantially more in the Dow, S&P 500, and/or Nasdaq Composite.
Although the Shiller P/E Ratio can’t pinpoint when the stock market will top or what catalyst will push equities over the proverbial edge, it does have an uncanny ability to foreshadow significant downside.
When the stock market is priced for perfection, there’s little or no margin for error. Factors that include on-again-off-again escalation with Iran, the ongoing closure of the Strait of Hormuz, and inflation uncertainty all threaten to put historically high valuations under a microscope.
Just because the Dow Jones Industrial Average, S&P 500, and Nasdaq Composite have thus far bucked a bear market, it doesn’t mean that President Trump’s prognostication of 20% to 25% downside won’t eventually come true.