

Several historical headwinds are mounting for Trump’s second year in office — and it’s worrisome news for Wall Street.
During President Donald Trump’s first term in the White House, the stock market soared. When he left office, the mature stock-driven Dow Jones Industrial Average (^DJI +0.66%), benchmark S&P 500 (^GSPC +0.19%), and innovation-fueled Nasdaq Composite (^IXIC 0.03%) had soared by 57%, 70%, and 142%, respectively.
Through the first 11 months and change of Trump’s second term as president, he oversaw an encore performance. Through the closing bell on Dec. 29, the Dow, S&P 500, and Nasdaq Composite have rallied 14%, 17%, and 22% year-to-date.
President Trump delivering the State of the Union address. Image source: Official White House Photo.
While history is quite clear that the stock market’s premier indexes rise in value over multi-decade periods, getting from Point A to B is anything but a straight line. As we turn the page to a new year, a spectrum of possibilities awaits Wall Street and investors — one of which is the potential for a stock market crash to take shape under President Trump.
Statistically, this is one of the priciest stock market’s in history
The first historical headwind has nothing to do with Donald Trump or his policies. Instead, it has everything to do with the stock market entering 2026 at its second priciest valuation in history, dating back to January 1871.
Even though valuation is a subjective term, the S&P 500’s Shiller Price-to-Earnings (P/E) Ratio leaves little doubt about the priciness of equities. The Shiller P/E is also commonly referred to as the cyclically adjusted P/E Ratio, or CAPE Ratio.
The S&P 500’s Shiller P/E, which is based on average inflation-adjusted earnings over the previous decade, has averaged a multiple of roughly 17.3 when back-tested to 1871. As of the closing bell on Dec. 29, the Shiller P/E clocked in with a multiple of 40.59. The only time a continuous bull market has been pricier is in the months leading up to the bursting of the dot-com bubble, when the Shiller P/E peaked at 44.19.
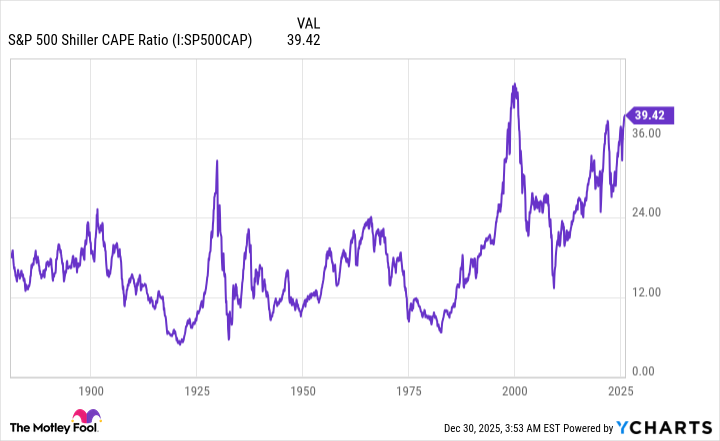
S&P 500 Shiller CAPE Ratio data by YCharts.
Although the Shiller P/E doesn’t help predict when stock market corrections, bear markets, or crashes might occur, it does have, thus far, a flawless track record of foreshadowing significant downside in Wall Street’s benchmark stock index.
Spanning 155 years, the Shiller P/E has surpassed 30 on six occasions, including the present. The previous five instances were all eventually followed by declines in the Dow Jones Industrial Average, S&P 500, and/or Nasdaq Composite, ranging from 20% to 89%. While a Great Depression-esque decline of 89% in the Dow is highly unlikely in modern times, we did witness the S&P 500 and Nasdaq shed 49% and 78% of their respective value on a peak-to-trough basis following the bursting of the dot-com bubble.
A historically pricey stock market increases the odds of a stock market crash in 2026 under President Donald Trump.
Historical precedent is a serious concern for Trump’s second year
However, there’s more to this story than just the stock market being historically expensive. Several historical correlations and precedents suggest that 2026 may be a challenging year for stocks.
To begin with, stock market volatility has typically picked up during midterm election years. Based on data aggregated by Carson Group’s Chief Market Strategist Ryan Detrick, the S&P 500’s peak-to-trough drawdown during midterm years has ranged from 4.4% to 37.6%, and averaged 17.5% since 1950. This 17.5% average correction during midterm years is the largest of any of the four years a president holds office.
Get ready to hear a lot about this, but midterm years tend to see their ultimate low later in the year and have some of the largest intra-year corrections.
The good news? Since 1950, off those lows stocks have never been lower a year later and up more than 30% on average. pic.twitter.com/WuWr8vWCJN
— Ryan Detrick, CMT (@RyanDetrick) November 16, 2025
This shouldn’t come as a surprise, as midterm elections can shake up which party controls Congress and make it more difficult for a president to implement their agenda. With Republicans holding a narrow advantage in the House of Representatives, a slight shift in voter support can lead to significant changes for Congress come January 2027.
Furthermore, history has shown that Republican presidencies and recessions go hand-in-hand.
Since 1913, 10 Republicans and nine Democrats have held the title of U.S. president. Four of the nine Democrats didn’t have a recession begin during their time in the Oval Office. Meanwhile, all 10 Republicans, including President Trump, have overseen the onset of a recession while in office. While this doesn’t guarantee that a recession will materialize during Trump’s second term, or that one will occur in 2026, it’s a historical precedent that’s been highly accurate, spanning more than a century.
Even President Trump’s tariff and trade policy foreshadows the potential for stock market weakness in the new year.
In December 2024, four New York Federal Reserve economists, writing for Liberty Street Economics, published a report (“Do Import Tariffs Protect U.S. Firms?”) that examined the impact Trump’s China tariffs, implemented in 2018 and 2019, had on businesses and equity markets. Economists found that public companies directly affected by Trump’s China tariffs endured declines in employment, labor productivity, sales, and profits from 2019 to 2021.
While none of these historical correlations in any way guarantees a stock market crash during Trump’s second year, the risk of a crash appears to be higher than usual in 2026.

Image source: Getty Images.
Stock market crashes beget opportunity for long-term-minded investors
However, the great thing about history is that it provides insight into both declining and rising stock markets.
As much as investors may dislike elevator-down moves in the Dow Jones Industrial Average, S&P 500, and Nasdaq Composite, these are perfectly normal, healthy, and inevitable events. While investor emotions can make the velocity and length of stock market downturns unpredictable, be aware that no amount of fiscal/monetary policy maneuvering or well-wishing can stop these events from occurring.
With this being said, stock market cycles aren’t mirror images of one another, which is a powerful realization for long-term-minded investors.
In June 2023, when the S&P 500 had officially bounced more than 20% off of its 2022 bear market low and entered a new bull market, the researchers at Bespoke Investment Group published a data set on X (formerly Twitter) comparing the length of every S&P 500 bull and bear market dating back to the start of the Great Depression.
It’s official. A new bull market is confirmed.
The S&P 500 is now up 20% from its 10/12/22 closing low. The prior bear market saw the index fall 25.4% over 282 days.
Read more at https://t.co/H4p1RcpfIn. pic.twitter.com/tnRz1wdonp
— Bespoke (@bespokeinvest) June 8, 2023
Bespoke found that the average S&P 500 bear market lasted just 286 calendar days, equivalent to approximately 9.5 months, since September 1929. In comparison, the typical bull market persisted 1,011 calendar days, or approximately 3.5 times longer.
Looking back even farther produces similar results.
Each year, the analysts at Crestmont Research update a data set that calculates the rolling 20-year total returns of the S&P 500, including dividends, since the start of the 20th century. Even though the S&P wasn’t officially incepted until 1923, researchers were able to track the performance of its components in other major indexes dating back to 1900.
What Crestmont Research was able to show is that all 106 rolling 20-year periods it examined (1900-1919, 1901-1920, and so on, to 2005-2024) produced a positive annualized total return. In plain English, all 106 periods would have been profitable had an investor, hypothetically, held an S&P 500-tracking fund for 20 years.
What these backward-looking analyses demonstrate is the power of time and optimism on Wall Street. Despite short-term directional moves being unpredictable, history is quite clear that the stock market’s major indexes should be higher 20 years from now, regardless of who is president.