
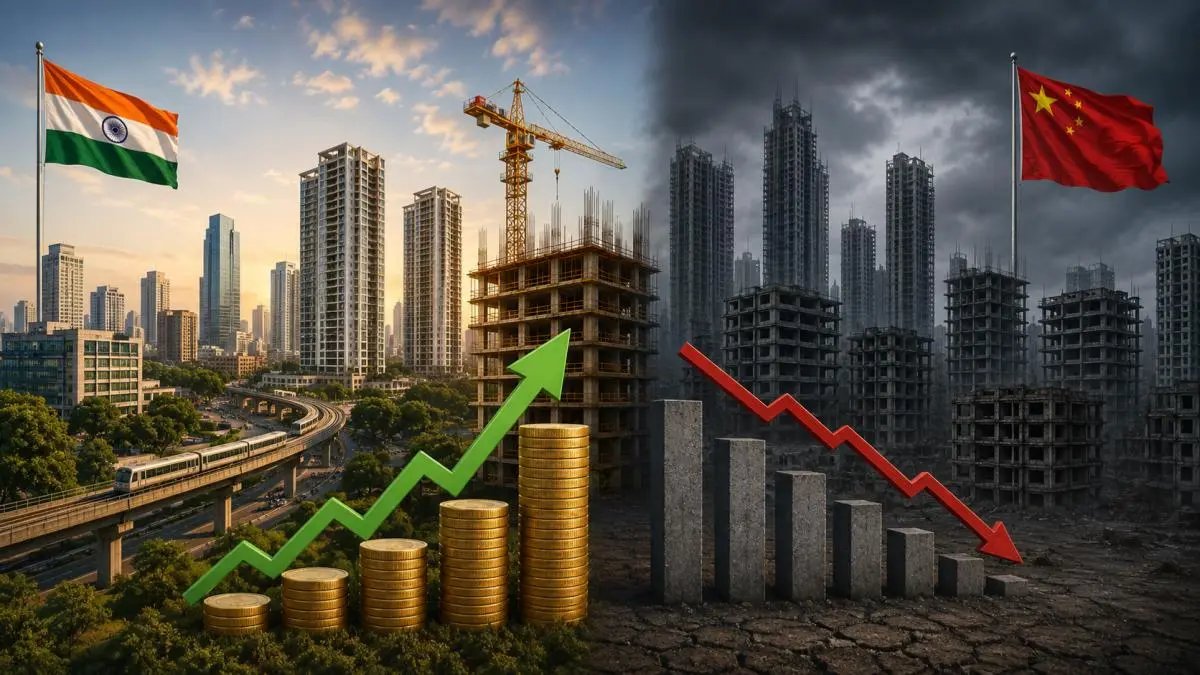
In a single year, the world’s two largest emerging economies moved in opposite directions in the property market. India’s professionally managed real estate market grew to $104 billion in 2025, a gain of $13 billion, according to the Morgan Stanley Capital International Real Estate Market Size Report released in August 2026. China’s property market shrank by $18 billion to $938 billion — the largest absolute decline of any market MSCI tracks.
That reversal is not a rounding error but a visible edge of a property downturn in China now entering its sixth year and of an Indian market that has so far avoided the same fate. Whether India continues to avoid it depends on choices being made now.
The scoreboard
MSCI studies 38 markets, and measures only what it calls professionally managed real estate — property held by institutions such as pension funds, insurers, listed trusts and large landlords for the purpose of earning investment returns. It leaves out the homes people live in, the offices companies occupy themselves, and government and social housing. In 2025, 35 of the 38 markets grew. Only three shrank: China, Hong Kong and Indonesia.
China slipped from second place to third, overtaken by the United Kingdom. Its share of that global institutional market fell from 7.69% to 6.96% — a drop of 73 basis points, the second-steepest after the United States. But the US decline was different in kind: America’s market grew in absolute terms to $5.1 trillion and lost weight only because European markets expanded faster. China lost weight because it actually contracted.
India, ranked 19th, moved the other way. Its global weight edged up from 0.73% to 0.77%. It did so despite the rupee weakening about 4.7% against the dollar — the single worst currency drag among all 38 markets, on MSCI’s figures. Backing that out suggests Indian growth in rupee terms was closer to 20%, though MSCI does not publish a local-currency figure.
One more contrast is worth noting. MSCI’s turnover ratio measures deal volume against market size. India’s was 7.7%, above the 6.9% global average. China’s was 3.8%. Indian assets are changing hands. Chinese ones largely are not.
What actually broke in China
The Chinese downturn began as a deliberate policy squeeze on developer leverage in 2020 and became something much larger.
New home prices across China’s 70 major cities fell 3.2% year-on-year in February 2026, according to the National Bureau of Statistics, the 32nd consecutive month of decline. Real estate investment dropped 16.2% year-on-year in the first five months of 2026. New construction starts fell 22.6% and completions 23.4%. Secondary-market prices in 100 cities fell again in June, with 88 of them recording declines, on data from the China Index Academy.
Commercial property has fared no better. Developers have defaulted on around $130 billion of debt, Bloomberg reported in its recent series on the sector. Office values in some major cities have fallen more than 40% from their peaks. Distressed sales made up a record 22% of all commercial transactions in 2024, on Bloomberg Intelligence estimates. Office vacancy rates in Chinese metros now range from 20% to over 40%, among the world’s highest.
Four structural failures sit underneath these numbers.
#1 Building where people were not going
According to research by economists Kenneth Rogoff and Yuanchen Yang in 2022, almost 80% of China’s housing stock was built in less wealthy tier-3 cities, which saw slower income growth and population outflows. The ratio of housing under construction to housing completed each year climbed from six times in 2011 to 10.6 times in 2020.
#2 Local governments hooked on land
The same research also found tier-3 cities relied on land sales for up to 43% of revenue, tier-2 cities 46%. When land sales stopped, municipal finances went with them.
#3 Pre-sales without ring-fencing
Buyers paid for homes years before delivery and developers spent that money on new land rather than construction. When credit tightened, projects stalled and mortgage boycotts followed.
#4 Rules nobody had written
Almost all urban land in China is state-owned and leased — 40 years for malls, 50 for offices, 70 for homes. Until recently there was no clarity on renewal. More than 1 trillion yuan of non-residential property now sits on leases of 20 years or less, a Bloomberg report quoted real estate analytics firm Cushman and Wakefield. Shanghai and Guangzhou have only now begun circulating renewal guidelines.
Nicholas Wilson, who runs Oxford Economics’ real estate economics service for Asia, told Bloomberg that global institutions do not expect a near-term recovery. He estimates the nominal value of buildings will be lower in 2030 than in 2020, which would amount, in his words, to a lost decade for Chinese commercial real estate.
Why India is not China
The differences are real and mostly structural.
Developer balance sheets are the first difference and also the sharpest. The average net debt-to-equity ratio of India’s top listed developers fell to 0.05 in FY25, down from a peak of 0.55 in FY17, according to Anarock.
DLF told the exchanges it closed FY26 with zero gross debt in its development business and a net cash surplus. Oberoi Realty’s gross debt-to-equity ratio stood at 0.16 in FY26, improved from 0.21 a year earlier, on its audited results. Chinese developers entered their downturn with the opposite profile: Beijing’s “three red lines” leverage caps were imposed in 2020 precisely because borrowing across the sector had run so far ahead of equity.
Secondly, regulation arrived before the crisis rather than after it. The Real Estate (Regulation and Development) Act, 2016 requires 70% of buyer money to sit in escrow accounts tied to construction — the precise mechanism whose absence let Chinese developers spend pre-sale receipts on fresh land. Enforcement has teeth in places.
In January 2025, MahaRERA suspended the registrations of 1,905 projects and froze their bank accounts for failing to submit mandatory progress updates. Pune accounted for the highest number of affected projects at 487. The regulator also barred the registration department from processing property sales in these projects. While enforcement remains uneven across states, the regulatory framework is in place.
Third, institutional capital is barely in the market. MSCI’s $104 billion counts only professionally managed stock. Mordor Intelligence estimates India’s total real estate market at $585 billion in 2026, with residential at 70% and households accounting for 66% of transaction value. Institutional money holds perhaps a fifth of the market. That limits contagion but also means the sector’s growth depends on household demand holding up.
Finally, the state has been intervening on stalled projects for six years. The SWAMIH Fund, managed by SBICAP Ventures, had committed to 148 projects covering 1,01,443 homes as of January 31, 2026, of which 63,200 were completed, Finance Minister Nirmala Sitharaman told the Lok Sabha in March 2026. A second Rs 15,000 crore fund targets another one lakh units. A 2019 PropEquity study had put the stalled universe at about 4.58 lakh units. So this is real progress, not a solved problem.
Warning lights on India’s dashboard
None of that makes India immune and the most recent data is uncomfortable. Housing sales across the top seven cities fell to 90,715 units in the April-June quarter of 2026, down 6% year-on-year and 11% sequentially, according to ANAROCK. Developers launched roughly 1,06,000 units in the same quarter, up 7%. Unsold inventory crossed 6,16,000 units, up 10% from a year earlier.
Supply is running ahead of demand. That is precisely how China’s problem began.
The composition matters as much as the volume. Knight Frank India found unsold stock increasingly concentrated in premium and luxury segments, while affordable housing inventory declined. Its quarters-to-sell measure stood at 14.2 quarters for homes priced Rs 20-50 crore and 9.7 quarters above Rs 50 crore. Bengaluru’s unsold stock rose 23% through 2025 as developers chased premium buyers.
The Reserve Bank of India cut the repo rate by 125 basis points during 2025 to 5.25% and has held it there since. Cheap credit has supported demand. It can also mask weak demand.
The stress is already visible where developers are weakest. Real estate accounted for 34% of all cases admitted under the Insolvency and Bankruptcy Code as on March 31, 2026, second only to manufacturing, and has held the largest share of admissions of any sector since FY2022, according to ICRA.
Its share of cases still pending is the highest of any sector at 41%. Recovery across the code has been poor — haircuts for lenders stood at 68% until FY2026, with realisations of just 23% against admitted claims in the March quarter. IBBI has since floated sector-specific proposals for real estate.
That is the qualification to the deleveraging story. Balance sheets at the top of the market are strong. Below it, developers are failing faster than the system can process them.
Five lessons worth writing down
#1 Watch inventory, not prices
Chinese prices held up long after supply had run away from demand. India’s inventory is rising while sales fall. That gap is the leading indicator.
#2 Do not let developers finance land with buyers’ money
RERA escrow is India’s single strongest defence. Its value depends entirely on state-level enforcement.
#3 Beware the premium trap
Developers chase high-ticket buyers because margins are better. China built for a demographic that did not materialise. India’s ultra-luxury quarters-to-sell numbers deserve close attention.
#4 Fix the rules early
China is writing lease-renewal guidelines three decades after granting the leases. India’s equivalents are unglamorous and consequential: land titling, approval timelines and insolvency resolution, where the average resolution time worsened to 744 days as on March 31, 2026 from 713 days a year earlier, according to ICRA’s analysis of IBBI data. This is 2.8 times the 270 days the law allows.
#5 Keep municipal finance off the land cycle
Chinese cities that funded themselves through land sales had no fallback. Indian urban bodies are pushing for greater reliance on land monetisation. The Chinese experience argues for caution.
India’s 2025 numbers are good. The 2026 quarterly numbers are less so. The distance between the two is where policy still has room to act.