

Key Takeaways
- Gold’s chart shows a tightening symmetrical triangle, rising long-term trend, and cooling momentum… ingredients for a potential breakout.
- Seasonal patterns, macro tailwinds, and even a 1979 analog point to strength as we move into year-end 2025.
- Gold miners (GDX) may already be confirming the move, with a fresh potential breakout and a measured move target in the low $90s.
Turn on financial TV, and you’ll quickly get your fill of the GPU-to-TPU shift. It’s undoubtedly an important tech trend and a twist in the AI story. But flying under the radar, remarkably, is gold. If history is a decent guide, the yellow metal could be gearing up for a glittering year-end rally.
Chart Patterns to Feast On
Let’s cast the narratives aside and focus on price action here at the get-go.
Notice in the chart below how gold is back in consolidation mode. It’s a familiar pattern to technicians, with a series of lower highs and higher lows. The symmetrical triangle is somewhat similar to what unfolded from April through August before the intense late-Q3/early-Q4 thrust.
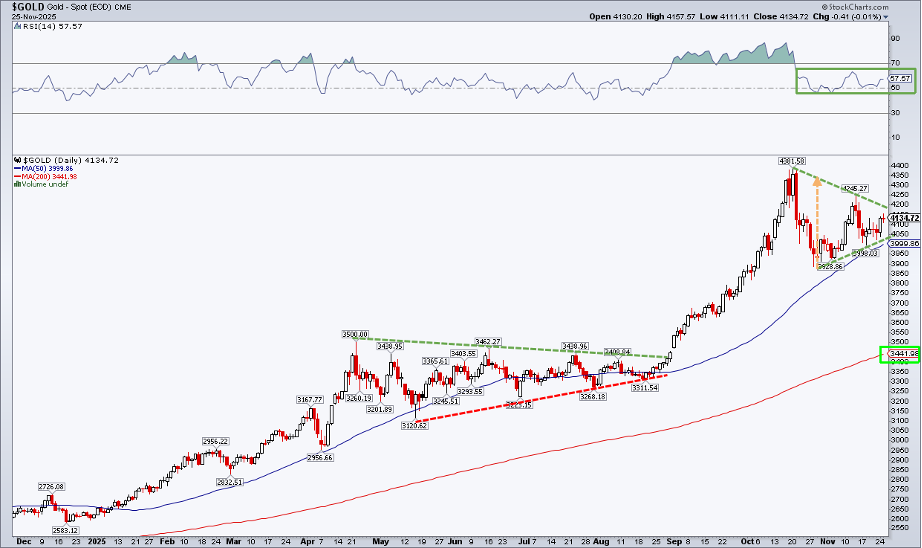
Gold’s Symmetrical Triangle Continuation Pattern, Rising 200-DMA, Cooler & Bullish RSI. Chart source: StockCharts.com
Carving Out a Gold Price Target
We can formulate a price target based on the formation, too. The height of the triangle is, call it, $460 ($4,350–$3,890). Now take that height and add it to a hypothetical breakout level of $4,150, and $4,610 could be in play sooner rather than later.
Long-time traders know I’m putting the cart before the horse here, but it at least gives us a sense of how strong the upside move could be. Also keep in mind that the run-up post-Labor Day was much more intense than the summertime technical pattern predicted.
The Trend Is Your Friend at the Table
But there’s more going on with gold’s daily chart than just the symmetrical-triangle continuation pattern unfolding. The long-term 200-day moving average is on the rise, suggesting that the bulls control the primary trend, with the 50-DMA above that and price leading both trend-indicator lines.
What’s more, the 50-DMA has not been breached since the Q2–Q3 price coil. Furthermore, the RSI momentum oscillator at the top of the chart has cooled considerably from 70+ in the early autumn to a mid-tier 40–70 zone. And it’s that range that is so bullish, as famed technician Connie Brown asserts. I encourage readers to dig into her RSI acumen.
Seasonality Served Warm
So the near-term technicals look good for gold. But how about the historical analogues as we close in on the end of 2025? Well, there’s really only one parallel at this point: 1979. Up 59% year-to-date, the shiny rock hasn’t posted a better YTD performance since the Carter administration.
What makes 1979 curiously bullish for precious-metal investors today is that gold soared from November 27 to the year’s close. It was a +34% move over just five weeks. That would imply $5,600 gold once the ball drops on New Year’s Eve 2025.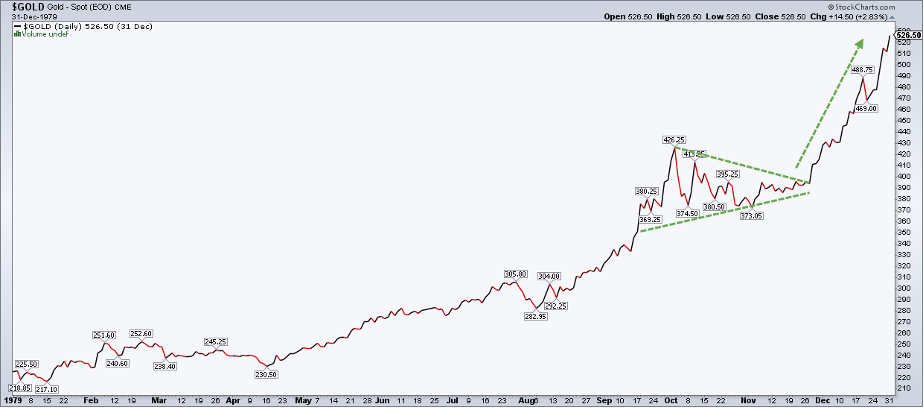
1979: Gold Gobbled Up Gains from Thanksgiving Through Year-End. Chart source: StockCharts.com
I’d also point out that other comparable years (1973 and 1974) featured rallies from Thanksgiving through the Santa Claus Rally period.
Most investors weren’t around to trade the thin and exclusive gold market decades ago, though. Over the past 20 years, price trends have been less stunning but still sanguine. Using StockCharts’ Seasonality view, you’ll discover decent returns and merely “good” positivity rates. Gold has averaged a 0.8% advance in November and December, up a slight majority of the time. The upshot? We can check off the seasonality box.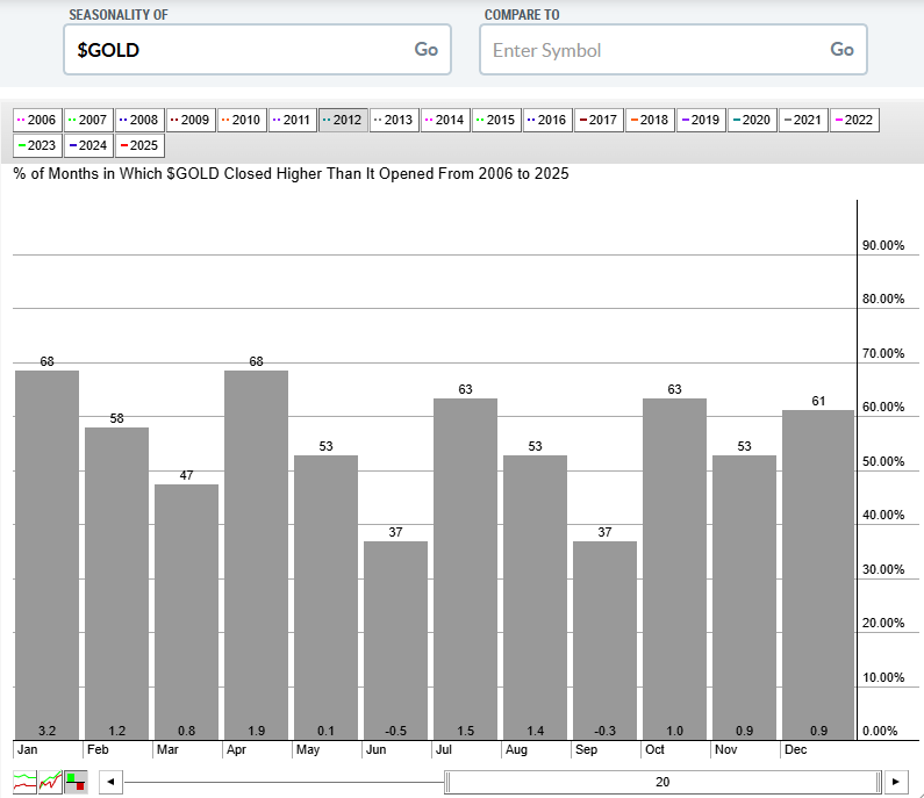
Gold: Stockings More Than Half-Full in December Since 2006. Chart source: StockCharts.com
What about the macro view? I’d say it also appears conducive to some holiday cheer for the precious-metals space. The possession arrow points to the doves on the Fed, with increasing confidence that the FOMC will on December 10. The current market-implied probability is north of 80%, and the Fed’s blackout period begins Saturday at midnight.
The dollar can also play a leading role in gold price trends. Readers know I’ve been eyeing the greenback throughout the second half. Up nicely since June 30, the US Dollar Index (USD) remains under key resistance at 100.50. Yes, a bullish rounded-bottom pattern is intact, but a breakdown below a support line going back to mid-September could put the bears in the pilot’s seat. Presumably, a dollar drop would be bullish for gold, though traditional intermarket-relationship rules have not been strictly followed this cycle.
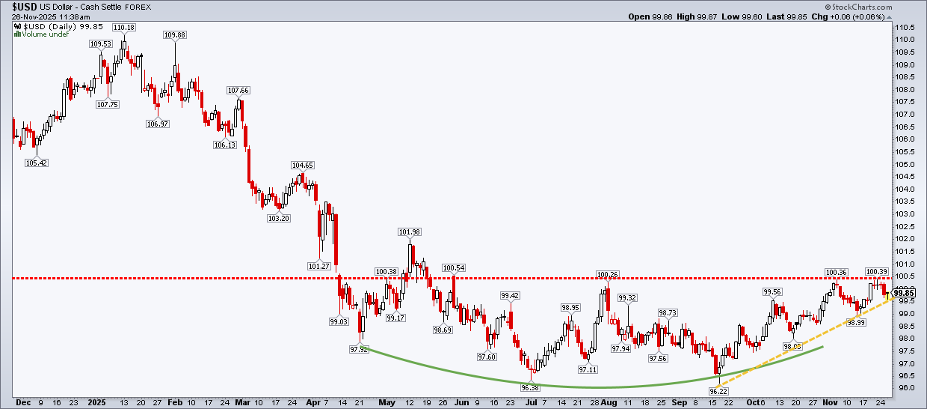
US Dollar Index: Bullish Rounded Bottom, Key Uptrend Support Line In Play. Chart source: StockCharts.com
Other factors, like liquidity, trends in the crypto space, and fiscal matters, are additional curveballs to consider. Ultimately, focusing on the gold chart could be your best path to hitting an end-of-year grand slam in the metals market.
As always, though, we don’t operate in a world of certainties. Rather, it is probabilities that should govern your trading process. The way things stand, I would put the odds of a five-week end-of-year gold climb relatively high.
To improve those odds, trends in gold equities can occasionally give you the upper hand. Gold bugs should give thanks, as the may already be breaking out. Like the metal, GDX peaked in mid-October. It went on to correct precisely 20%, then held $68 on a retest earlier this month. A gap fill to $81 was the next technical event, and higher highs and higher lows have progressed to today.
Now, above $79 (using StockCharts’ “Extended Hours” toggle on the SharpCharts Scale & Display Settings), the fund could be emerging from a symmetrical triangle of its own. $81 and $85 are resistance spots. If this ascent is the real-deal breakout, then a measured-move price target of about $93 is triggered for GDX.
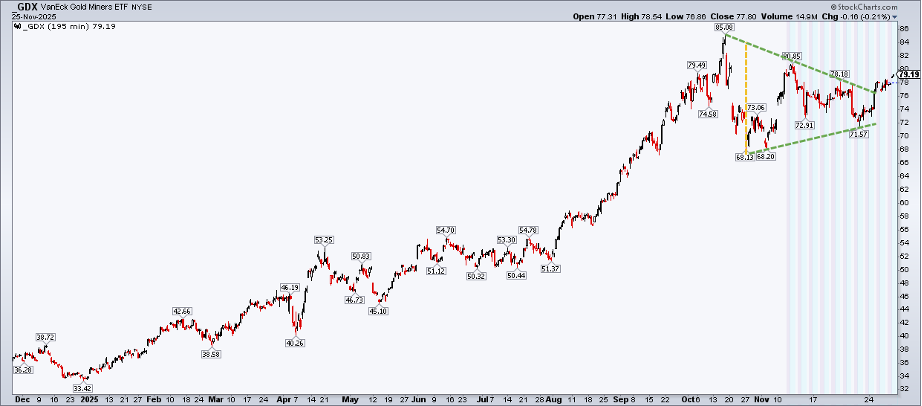
GDX: Possible Breakout Would be Gravy for Gold. Chart source: StockCharts.com
The Bottom Line
Is 1979’s past this year’s prologue? Probably not exactly (n=1, of course), but after a historic gold boom, precious-metals sentiment is softer, and news stories have turned fewer. Along with a price coil, this could be the ideal setup for a year-end gold rally.