

- S&P 500 futures remain bullish despite recent trend break; key resistance at 6470.
- Bond market recovery boosts stocks; stagflation risks may resurface with new data.
- Key economic reports, including non-farm payrolls, will shape Fed rate expectations.
- Looking for actionable trade ideas to navigate the current market volatility? Subscribe here to unlock access to InvestingPro’s AI-selected stock winners.
S&P 500 Analysis
US index futures and European indices rose in the first half of Thursday’s session, after Wall Street rebounded late in the day yesterday, lifted by several heavyweight technology stocks. On a macro level, traders’ conviction of a grew further after the report indicated further cooling in employment.
We will have more economic data to look forward to in the next couple of days, which could well shape rate expectations further and provide direction for stocks.
Watch the Bond Markets
It was the slump in long-dated global bonds that caused stocks to drop on Tuesday. When they recovered on Wednesday, risk appetite improved and up went stocks. This morning saw Treasuries extend those gains, with the yield on the benchmark 10-year notes falling two basis points to 4.19.
Despite the calm, concerns over stretched valuations and government finances remain and this is something that could be back in focus should this week’s data further highlight stagflation risks.
We will get more updates on the jobs market today with the release of the private payrolls report, weekly and the of the . Friday’s report will be quite important in as far as expectations for the Fed’s future policy is concerned.
Technical Analysis and Trade Ideas
The S&P 500 futures chart still paints an overall bullish picture, but price action in the last few days hasn’t been great. Things have turned a bit muddy after the index broke its short-term trend line during Tuesday’s drop, which gave rise to follow-up technical selling before dip-buyers stepped in right at 6370 support.
The index has now arrived at a potential resistance zone circa 6,470, which marks a prior support and resistance area and the underside of the broken trend line. The bulls will need to reclaim this level on a daily closing basis if we are to see a push beyond 6,500 in the coming days.
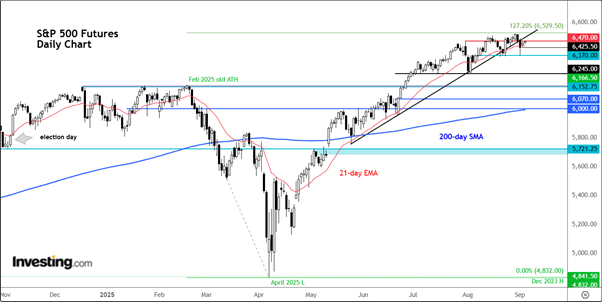
Looking at the shape of the candlestick patterns, there is an inside bar formation following yesterday’s bounce on the daily time frame. Given the location of the inside bar pattern i.e., just beneath the trend line, and taking into account the recent loss of bullish momentum, one has to be extra careful when trading on the back of it. Indeed, the bears would be eyeing a potential failure of the inside bar scenario.
That is, if we go back below the high of Tuesday’s range (6464) and hold below it, then in all likelihood, the index may go on to drop to take out liquidity that would now be resting below the low of Tuesday’s range (6425). If that level is taken out, then why stop there? A bigger pool of liquidity is likely to be below the 6370 support level given that area is a more defined support zone.
In any case, while we could see some chop and churn in the short-term, especially as it is an NFP week, the longer-term bullish price structure means the downside risks could be limited. In the event of a mini correction, we could see a decent bounce off the old record high of around 6150-6166 area. Ahead of this medium term support area, 6,300 and 6,245 are additional support levels to watch.
On the upside, there is not much resistance beyond the aforementioned 6470 and 6500 levels, given that we are trading not too far off the recently achieved record high. Round handles like 6,500, 6,600 and Fibonacci extension levels such as 6530 (i.e., the 127.2% extension of the Feb-April downswing) are among the upside targets.
***
InvestingPro provides a comprehensive suite of tools designed to help investors make informed decisions in any market environment. These include:
- AI-managed stock market strategies re-evaluated monthly.
- 10 years of historical financial data for thousands of global stocks.
- A database of investor, billionaire, and hedge fund positions.
- And many other tools that help tens of thousands of investors outperform the market every day!
Not a Pro member yet? Check out our plans here.
Disclaimer: This article is written for informational purposes only; it does not constitute a solicitation, offer, advice, counsel or recommendation to invest as such it is not intended to incentivize the purchase of assets in any way. I would like to remind you that any type of asset, is evaluated from multiple perspectives and is highly risky and therefore, any investment decision and the associated risk remains with the investor.