
Investors often turn to commodities as a hedge against rising inflation. But given evolving market dynamics and the sharp stress periods of recent years, should investors revisit their ideas around the broad asset class? At the start of 2022, Ben Johnson asked, “Do commodities have a place in your portfolio?,” followed by Bobby Blue’s answer to the question, “Why are so many commodity funds underperforming?” If there is one point of agreement, it’s that commodity profiles aren’t what they were, but that certainly doesn’t mean that they don’t belong in a diversified portfolio.
In our recently published 2022 Diversification Landscape report, we took a deep dive into how different asset classes performed in the past couple of years, how correlations between them have changed, and what those changes mean for investors and financial advisors trying to build well-diversified portfolios. In this piece, we consider commodities.
The Basics
Commodities are traditionally defined as raw materials or other basic ingredients used in manufacturing and industrial processes. As basic materials, they are essentially interchangeable with other commodities of the same type. And because their prices depend only on the balance of supply and demand, they often show very low correlations with other classes. They can also be a useful hedge against inflation. Commodities themselves are a major part of most inflation indexes, and it makes sense that their prices tend to rise when inflation is increasing. Some commodities also show seasonal price movement, which can affect returns over shorter periods.
Recent Performance Trends
Rising inflation generated a compelling backdrop for various commodities during 2021. The price of WTI crude oil began 2021 at roughly $48 per barrel and climbed to $75 per barrel by year-end. Increased travel capacity throughout 2021 fueled demand, while supply, which was pared back the previous year during the global coronavirus pandemic, remained limited by OPEC, which sets production caps. U.S. shale drillers were also reluctant to increase capacity. These market dynamics kept the return on oil competitive as equities continued to make gains; the Bloomberg Sub WTI Crude Oil Index rose 62% in 2021, recovering from its 51% loss the prior year, and posted its highest calendar-year return in a decade. Rebounding demand from China and continued demand for environmentally focused electric projects drove strong demand for copper over the year, and the Bloomberg Sub Copper Index subsequently generated a 27% return. In contrast, the LBMA Gold Price PM Index lost 4.33% as investors favored higher-risk assets during most of the year.
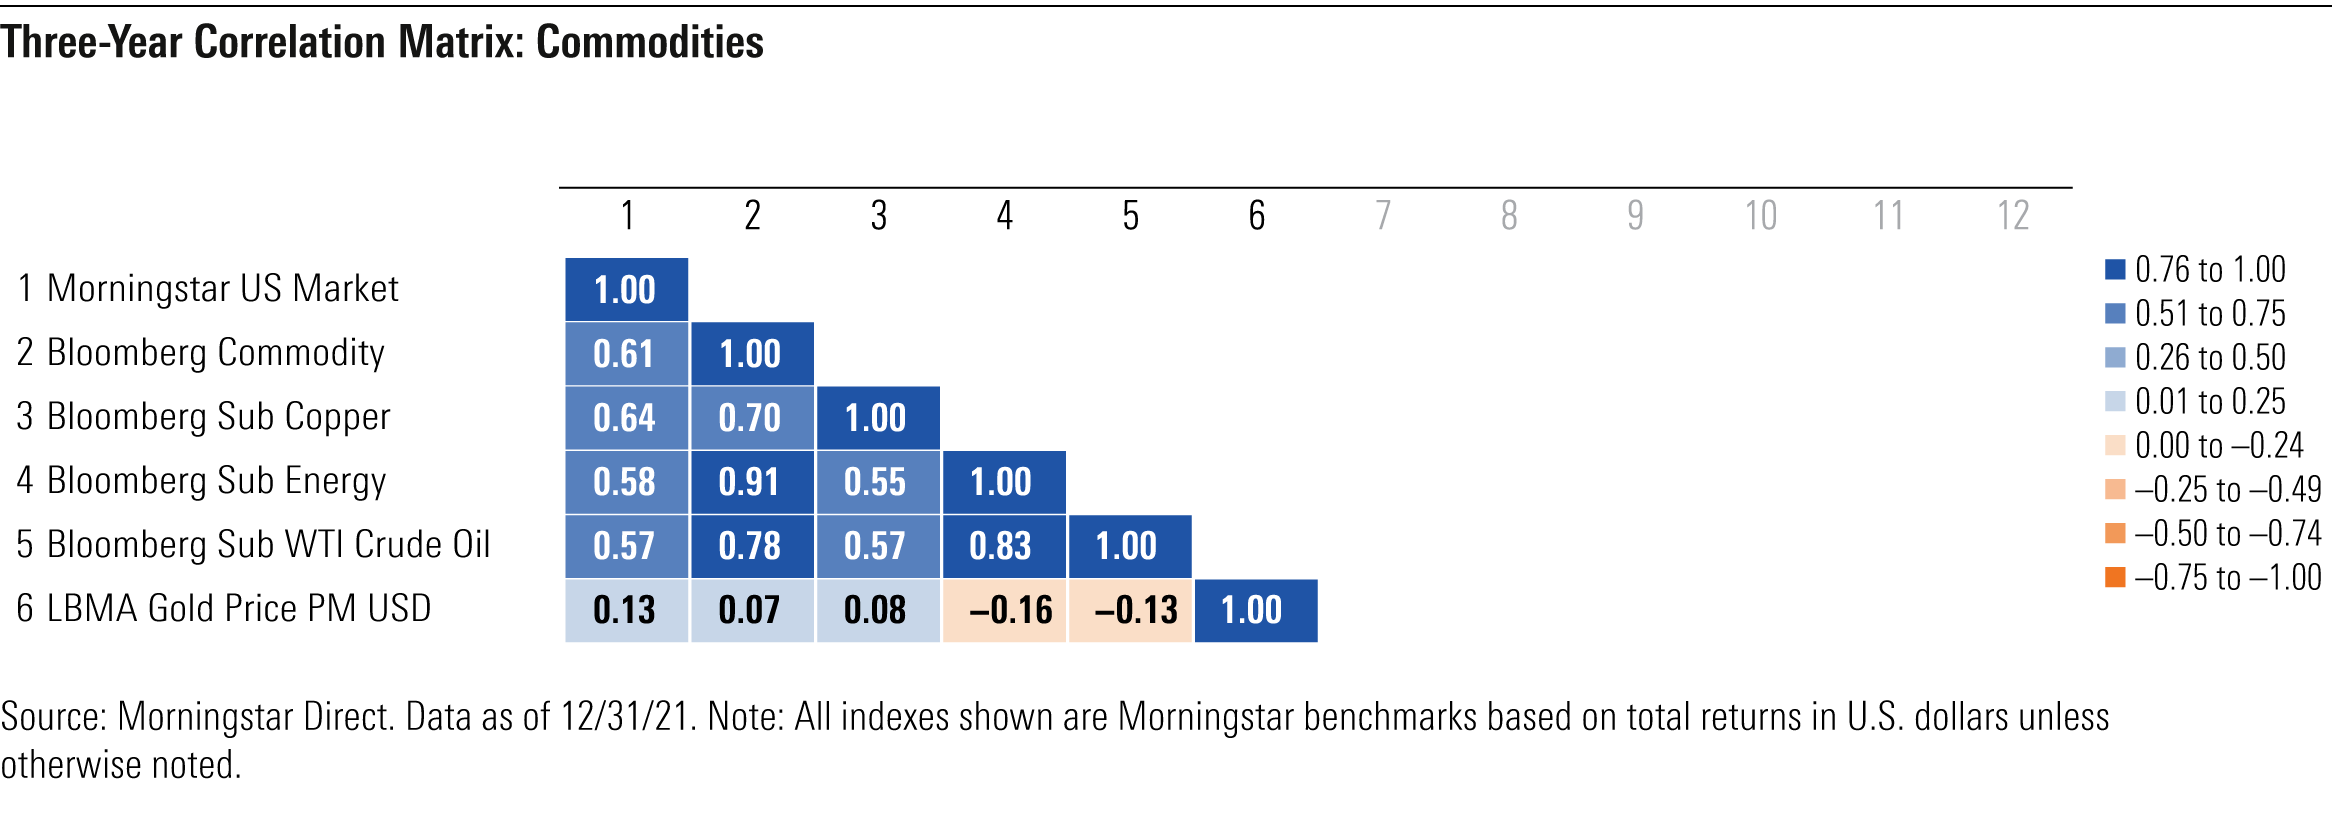
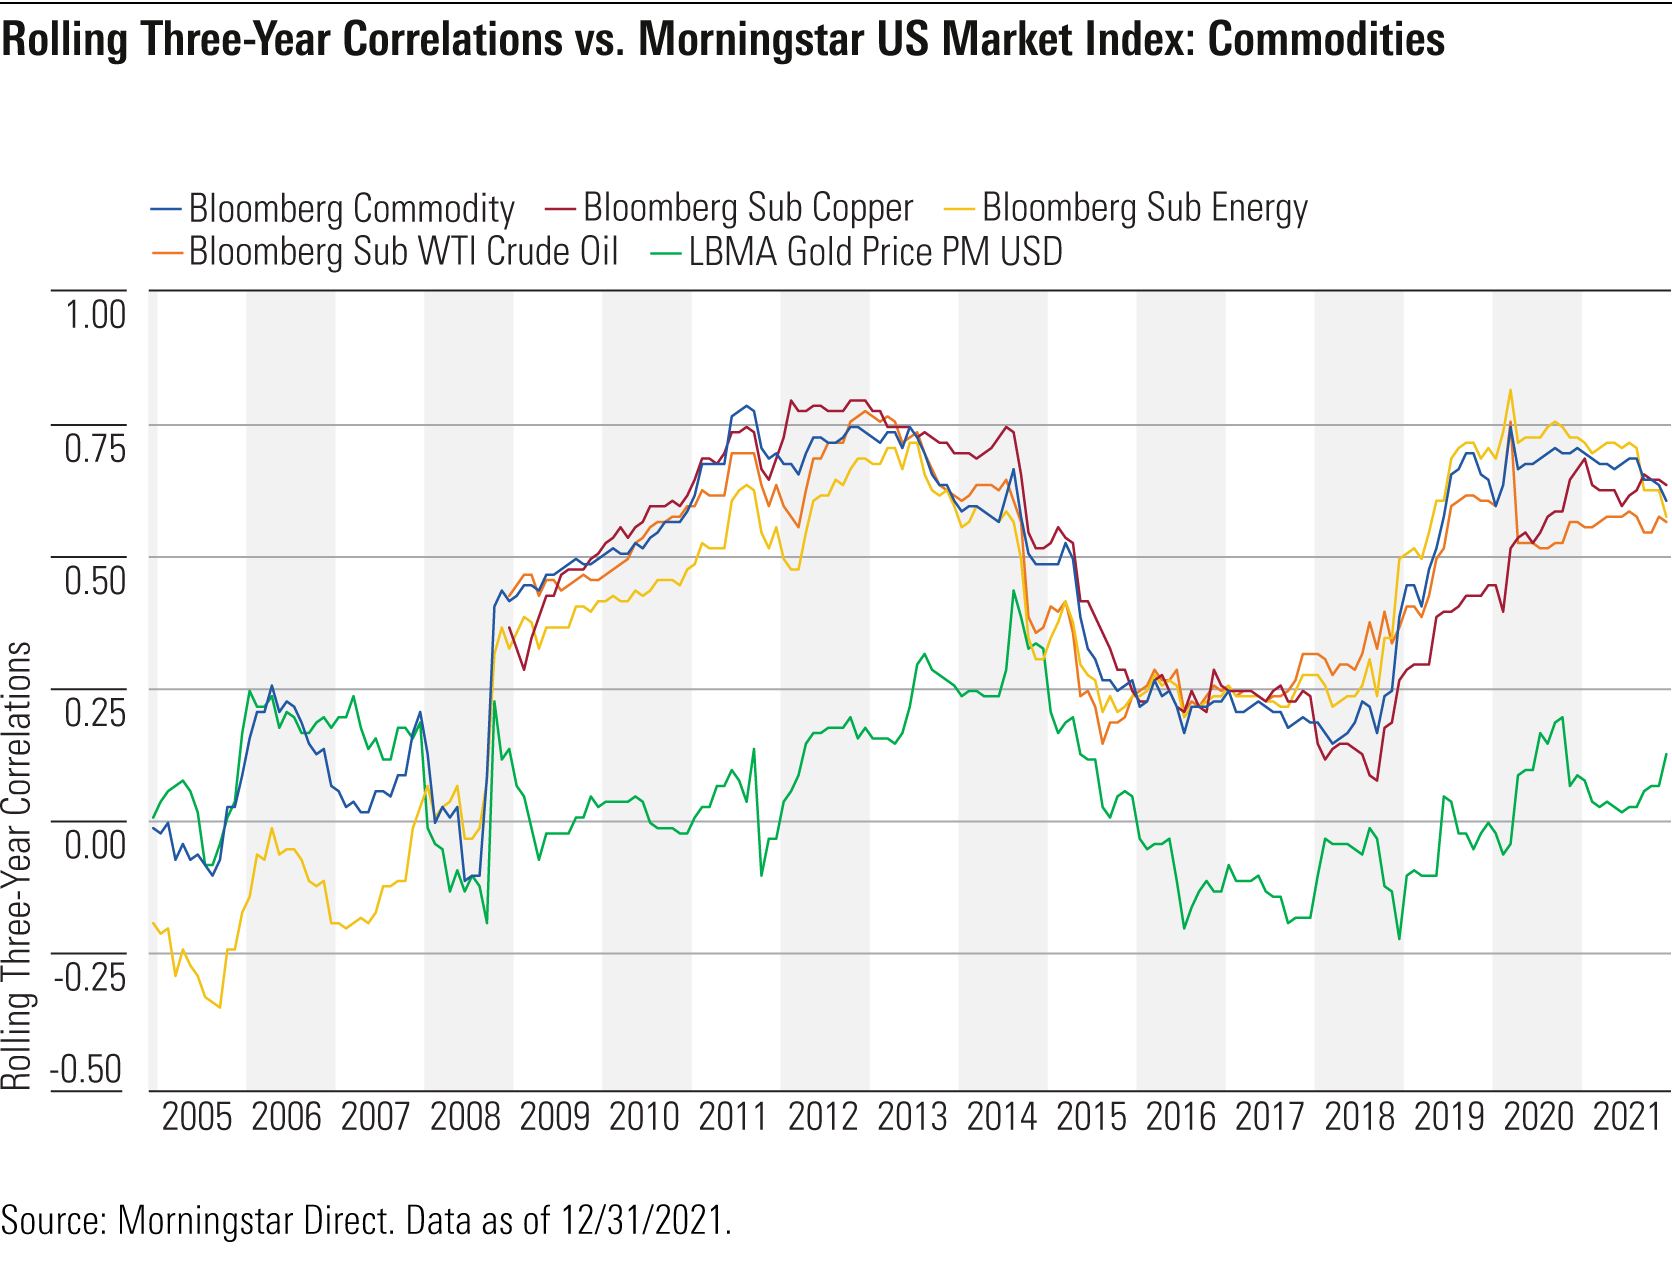
In 2021, the Bloomberg Commodity Index showed a trailing three-year correlation versus the Morningstar US Market Index of between 0.60 and 0.70, higher than the 0.49 average three-year correlation over the previous decade. This increase mainly reflects the impact of the 2020 pandemic panic, when commodity correlations spiked. During placid markets, those correlations sat much lower, and as inflation picked up in 2021, correlations also fell to historically expected levels.
Over the year ended December 2021, increased demand and constrained supply buoyed the prices of oil and copper, resulting in profiles that behaved more like equities. Over the past decade, the average three-year rolling correlations for oil and copper registered at 0.47 and 0.48, but in 2021 alone, the average three-year rolling correlations clocked in higher at 0.57 and 0.64, respectively. In contrast, over the past decade, the average three-year rolling correlation for gold registered much lower, and unlike copper or oil, in 40% of months over that period, the three-year rolling correlation was negative.
Historically, commodities have generally been a strong hedge against inflation, but it is not clear whether this will hold true in the future. Over the past two years, major commodity indexes have actually had a slight negative correlation with inflation. However, commodities have exhibited negative correlations versus market volatility (as measured by the CBOE VIX Index), with the exception of gold, which hovered around zero.
Portfolio Implications
Now that investors increasingly treat commodities as a financial asset, their value as portfolio diversifiers, particularly during bouts of extreme market stress, has diminished relative to historical expectations. Long-term returns relative to other broad asset classes haven’t been that compelling, either. Yet during inflation spikes, commodities often provide diversification value and deserve consideration in a portfolio with a variety of potential market environments top of mind. Notably, gold continues to fill a valuable role as a buffer against equity market volatility. It is also worth noting that the way investors gain access to commodities plays a major role in the potential outcomes. Roll yield and implementation decisions can all have a significant impact on results.