
Close Menu
Invest Insider News
    Facebook X (Twitter) Instagram
    Wednesday, September 30
    Facebook X (Twitter) Instagram Pinterest Vimeo
    Invest Insider News
    • Home
    • Bitcoin
    • Commodities
    • Finance
    • Investing
    • Property
    • Stock Market
    • Utilities
    Invest Insider News
    Home»Commodities»Has the Bust Begun? Gold to Commodity Ratio Suggests It May Already Be Here
    Commodities

    Has the Bust Begun? Gold to Commodity Ratio Suggests It May Already Be Here

    August 13, 20243 Mins Read


    By our reckoning, during the first half of 2022 the US economy entered the bust phase of the economic boom-bust cycle caused by monetary inflation (rapid monetary inflation causes a boom that inevitably is followed by a bust as the receding monetary tide exposes the boom-time malinvestments). The bust phase almost always culminates in a recession, although it doesn’t have to.

    So far, the performances of commodity prices in both US$ terms and terms are consistent with an economy in the bust phase, in that last week the GSCI Spot Commodity Index (GNX) tested its cycle low in US$ terms and made a new 3-year low in gold terms. The following daily chart shows GNX in gold terms, that is, it shows the commodity/gold ratio.

    Booms and busts are defined by the commodity/gold ratio, with booms being multi-year periods during which the commodity/gold ratio trends upward and busts being multi-year periods during which the commodity/gold ratio trends downward.GNX:GOLD-Daily Chart

    Note that it is not unusual for the stock market, as represented by the (SPX), to trend upward for a considerable time after the start of an economic bust. For example, an economic bust started in October of 2018 but the SPX didn’t peak until February of 2020. Therefore, the fact that the SPX made a new all-time high as recently as last month is not inconsistent with the US being in the bust phase of the economic cycle.

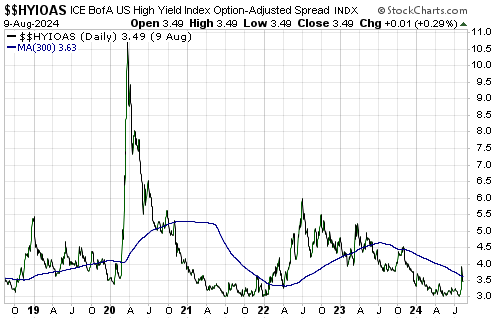
    What is inconsistent with the bust phase are credit spreads, which prior to the turmoil of the past 1.5 weeks were at their boom-time lows. However, the relatively low average level of US credit spreads does not mesh with the relatively large number of corporate bankruptcies, so it’s likely that credit spreads are sending a misleading signal.

    The misleading signal could be the result of junk-rated corporations delaying their re-financings for as long as possible in the hope that if they wait long enough, they will be able to re-finance at lower interest rates during the next Fed rate-cutting cycle. The problem that many of these companies will encounter is that a Fed rate-cutting cycle probably will begin near the start of a recession and a multi-quarter period during which interest rates fall on high-quality debt while rising rapidly on low-quality debt.

    In a  we wrote that the conflict between the signal from the commodity/gold ratio and the signal from credit spreads would have to be resolved either by credit spreads widening substantially in response to evidence of economic weakness or by the prices of industrial commodities rising substantially in response to evidence that a new boom had been ignited.

    Our view then and now is that the former is by far the more likely outcome. In fact, there’s a good chance that last week’s rise in the credit-spreads indicator shown on the following daily chart marked an important turning point.HYIOAS Index-Daily Chart


    Source link

    Share. Facebook Twitter Pinterest LinkedIn Tumblr Email
    Previous ArticleCommodity Roundup: Gold trades in red ahead of U.S. data, demand fears hurt copper, oil
    Next Article Bitcoin and Ethereum Rally Could Set Off a ‘Sexy Shitcoin Soiree’ Ahead of Election: Arthur Hayes

    Related Posts

    Commodities

    Tokenized commodities in DeFi reach $133M as Aave dominates with 51% market share

    September 24, 2026
    Commodities

    Solana’s tokenized commodities surge to $87M weekly volume as Raydium dominates trading

    September 23, 2026
    Commodities

    The Commodities Feed: Oil cools off from the highs | articles

    September 20, 2026
    Leave A Reply Cancel Reply

    Top Posts

    How is the UK Commercial Property Market Performing?

    December 31, 2000

    How much are they in different states across the US?

    December 31, 2000

    A Guide To Becoming A Property Developer

    December 31, 2000
    Stay In Touch
    • Facebook
    • YouTube
    • TikTok
    • WhatsApp
    • Twitter
    • Instagram
    Latest Reviews
    Property

    Plymouth had UK’s steepest rise in house prices in 2025 | House prices

    December 29, 2025
    Bitcoin

    Bitcoin (BTC) peut menacer le dollar, selon le PDG de BlackRock

    April 1, 2025
    Stock Market

    Stock Market LIVE Updates: GIFT Nifty hints a muted opening; NLC India, Infosys, ICICI Lombard, Just Dial in focus

    January 13, 2026
    What's Hot

    European Markets Surge. German Stocks Are Winning Again.

    April 23, 2025

    FTSE 100 Eyes Fresh Catalysts as Global Rally Broadens

    June 26, 2026

    BofA looks at which European stocks have performed well after energy price shocks By Investing.com

    March 5, 2026
    Most Popular

    Stock market today: Dow, S&P 500, Nasdaq mixed after Trump orders Hormuz blockade against Iran – Yahoo Finance

    April 13, 2026

    Bitlux a annoncé des cartes à jets privés en acceptant les paiements Bitcoin et Crypto

    May 27, 2025

    US stock market today: Dow, S&P 500 futures rise on hopes of US-Iran war de-escalation

    April 1, 2026
    Editor's Picks

    Bitcoin warning from one of South Africa’s richest women – BusinessTech

    September 22, 2025

    Montana’s gubernatorial candidates release their property tax reform proposals

    August 17, 2024

    Bitcoin Whale Holding Satoshi-Era Stash Moves More Coins to Kraken

    October 15, 2024
    Facebook X (Twitter) Instagram Pinterest Vimeo
    • Get In Touch
    • Privacy Policy
    • Terms and Conditions
    © 2026 Invest Insider News

    Type above and press Enter to search. Press Esc to cancel.