

Close Menu
Invest Insider News
    Facebook X (Twitter) Instagram
    Saturday, August 8
    Facebook X (Twitter) Instagram Pinterest Vimeo
    Invest Insider News
    • Home
    • Bitcoin
    • Commodities
    • Finance
    • Investing
    • Property
    • Stock Market
    • Utilities
    Invest Insider News
    Home»Bitcoin»Failure To Break $71,800 Keeps Downside Risk Alive
    Bitcoin

    Failure To Break $71,800 Keeps Downside Risk Alive

    February 16, 20264 Mins Read


    Bitcoin Price Weekly Outlook

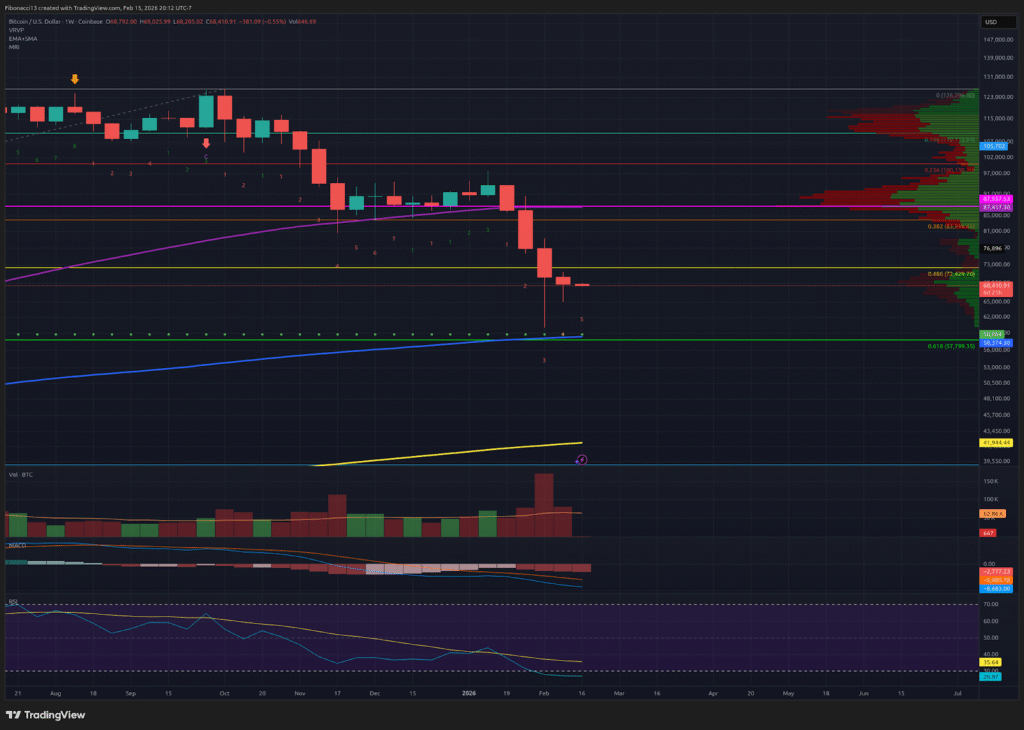
    The past week’s price action has been rather lackluster for Bitcoin. After seeing a big bounce from $60,000, the price failed to get above short-term resistance at $71,800 last week. Instead, the price tested the short-term support at $65,650 before bouncing back up to close the week out at $68,811. While the weekly chart is showing some buying strength below $66,000, the lack of follow-through for buyers on the bounces so far is a sign of weakness. Look for the price to drift towards the $60,000 lows this week if the bulls can’t keep it above $71,000 on a daily close to challenge higher levels.
    Bitcoin Bears Dominate: Failure to Break $71,800 Keeps Downside Risk Alive

    Key Support and Resistance Levels Now

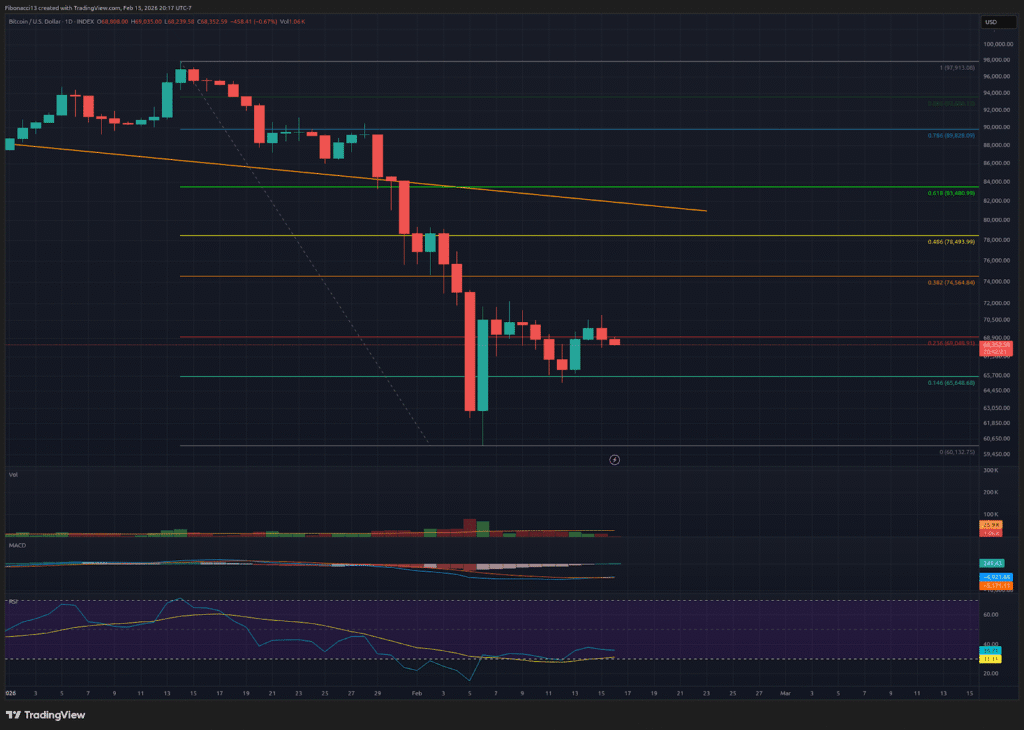
    Last week, $65,650 proved to be valid short-term support as the price dipped just below it before rallying quickly back above it. If a day closes below $65,650, look for $63,000 to act as support. Below $63,000, we have the 0.618 Fibonacci retracement at $57,800. This is a key level to hold as there isn’t much support below until $44,000.

    If the bulls can muster up some strength, resistance still sits overhead at $71,800. Closing above this level leads to $74,500, with $79,000 resistance above here. If the bulls can somehow manage to get above $79,000 (unlikely), $84,000 remains as a very strong barrier up above.
    Bitcoin Bears Dominate: Failure to Break $71,800 Keeps Downside Risk Alive

    Outlook For This Week

    The outlook for this week is a tough one to call. U.S. markets are closed on Monday, so don’t expect too much movement until Tuesday morning. We really could go either way from this $68,800 close. I would look for the $67,000 level to be tested early this week, and if we see support near there, we may be able to push past $71,000 later into the week. If $67,000 is lost, though, look for the low $60,000 to be challenged once again.

    Market mood: Very bearish – The price could not manage to gain any upward momentum last week at all. The bears are in full control.

    The next few weeks
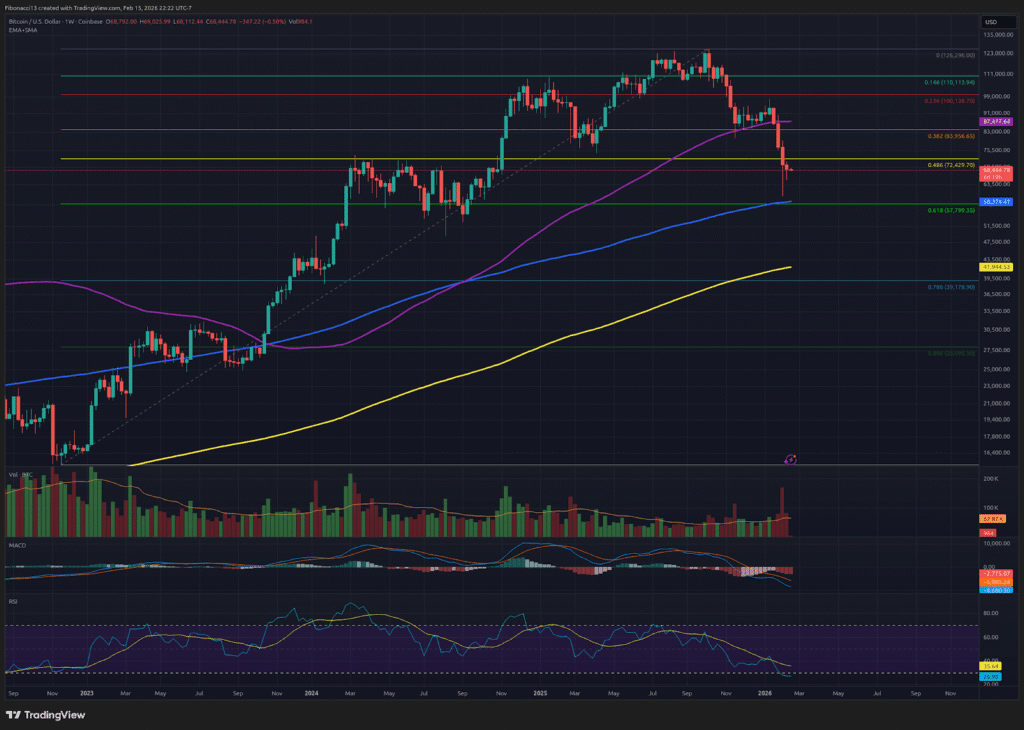
    As I mentioned last week, the price may range in the area from $60,000 to $80,000 for a while, with maybe a wick down to the 0.618 Fibonacci retracement at $57,800. At the moment, this ceiling can be lowered to $74.5k. There is no telling exactly when the impending “Crypto Bill” will be passed by Congress, or exactly what it will entail for the crypto space as a whole. It is not guaranteed to result in higher prices for bitcoin when it eventually passes, either, so for now, we must rely on the technicals to guide us. For the time being, the bias is still bearish, and if we lose $57,800, the bitcoin price will likely take the next leg down.
    Bitcoin Bears Dominate: Failure to Break $71,800 Keeps Downside Risk Alive

    Terminology Guide:

    Bulls/Bullish: Buyers or investors expecting the price to go higher.

    Bears/Bearish: Sellers or investors expecting the price to go lower.

    Support or support level: A level at which the price should hold for the asset, at least initially. The more touches on support, the weaker it gets and the more likely it is to fail to hold the price.

    Resistance or resistance level: Opposite of support.  The level that is likely to reject the price, at least initially. The more touches at resistance, the weaker it gets and the more likely it is to fail to hold back the price.

    Fibonacci Retracements and Extensions: Ratios based on what is known as the golden ratio, a universal ratio pertaining to growth and decay cycles in nature. The golden ratio is based on the constants Phi (1.618) and phi (0.618).


    Source link

    Share. Facebook Twitter Pinterest LinkedIn Tumblr Email
    Previous ArticleWhich Latin American Stocks are in Jefferies’ Watchlist By Investing.com
    Next Article Metaplanet Reports $619 Million Loss As Bitcoin Holdings Take Hit

    Related Posts

    Bitcoin

    A $110 million question: How safe are crypto wallets and what’s the best way to store bitcoin?

    August 7, 2026
    Bitcoin

    Whale boosts Bitcoin long exposure on Hyperliquid amid HYPE token transfers

    August 7, 2026
    Bitcoin

    Trump-backed American Bitcoin board member adds $1.9 million to personal stake

    August 7, 2026
    Leave A Reply Cancel Reply

    Top Posts

    How is the UK Commercial Property Market Performing?

    December 31, 2000

    How much are they in different states across the US?

    December 31, 2000

    A Guide To Becoming A Property Developer

    December 31, 2000
    Stay In Touch
    • Facebook
    • YouTube
    • TikTok
    • WhatsApp
    • Twitter
    • Instagram
    Latest Reviews
    Commodities

    NCDEX plans foray into equity & derivatives with Rs 400-600 crore investment: Report – Commodities News

    February 12, 2025
    Commodities

    Commodities overview: Gold is back in the spotlight

    July 15, 2024
    Bitcoin

    Bitcoin ‘accumulateur’ mieux adapté aux entreprises que la stratégie de moyenne des coûts à un coût, ce qui suggère la recherche

    June 18, 2025
    What's Hot

    The biggest mistake Bitcoin investors make, according to Market Wizard’s Adib Noorani

    November 10, 2025

    United Utilities unveils £30m plan to create a ‘spongier’ Liverpool 

    June 10, 2026

    Was bitcoin’s mysterious creator a Canadian? A new HBO documentary says yes (maybe)

    October 9, 2024
    Most Popular

    Why could Bitcoin Cash price rally above $600?

    October 9, 2025

    Joy City Property enregistre des ventes contractuelles de 20,5 milliards de yuans en 2024 -Le 14 mars 2025 à 07:32

    March 13, 2025

    Indian stock market remains volatile amid mixed signals around US-Iran war. Is the worst over?

    May 27, 2026
    Editor's Picks

    Kirk Greene: Historical Investing Data Show Markets Outperform Politics in Election Years | Homes & Lifestyle

    August 23, 2024

    La Caisse des dépôts, critiquée sur son action climatique, assume sa stratégie

    April 14, 2025

    How Likely Is It That the Stock Market Crashes Under President Donald Trump in 2026? 3 Historically Accurate Correlations Weigh In.

    January 10, 2026
    Facebook X (Twitter) Instagram Pinterest Vimeo
    • Get In Touch
    • Privacy Policy
    • Terms and Conditions
    © 2026 Invest Insider News

    Type above and press Enter to search. Press Esc to cancel.