

- Bitcoin price approaches $118,000 round-figure resistance but then retraces amid steady spot ETF inflows.
- Ethereum surges 16% from last week’s support as bulls tighten grip, aiming for highs above $4,000.
- XRP extends gains, reflecting risk-on sentiment in the broader cryptocurrency market.
The cryptocurrency market is relatively bullish on Friday, buoyed by renewed risk-on sentiment from both institutional and retail investors. Bitcoin (BTC) surged toward the $118,000 round-figure resistance before retreating slightly to trade at around $116,525 at the time of writing.
Leading altcoins, including Ethereum (ETH) and Ripple (XRP), remain steady as their uptrends near July peak levels. For instance, after tagging an intraday high of $3,969, the Ethereum price is trading at $3,902 at the time of writing. On the other hand, the cross-border money remittance token, XRP, appears to be steadying the uptrend after testing resistance near $3.40.
Market overview: Bitcoin, ETH spot ETFs extend inflows
Interest in Bitcoin and Ethereum spot Exchange Traded Funds (ETFs) is gradually returning based on the steady inflows experienced over the last few days. Bitcoin spot ETFs operating in the US saw a daily net inflow of $281 million on Thursday, marking the second consecutive day of inflows.
BlackRock’s IBIT ETF led with inflows of $157 million, followed by Fidelity’s FBTC with $43 million, while VanEck’s HODL closed the top three with $21 million. Only Ark Invest’s ARKB saw net outflows totaling $388,000.
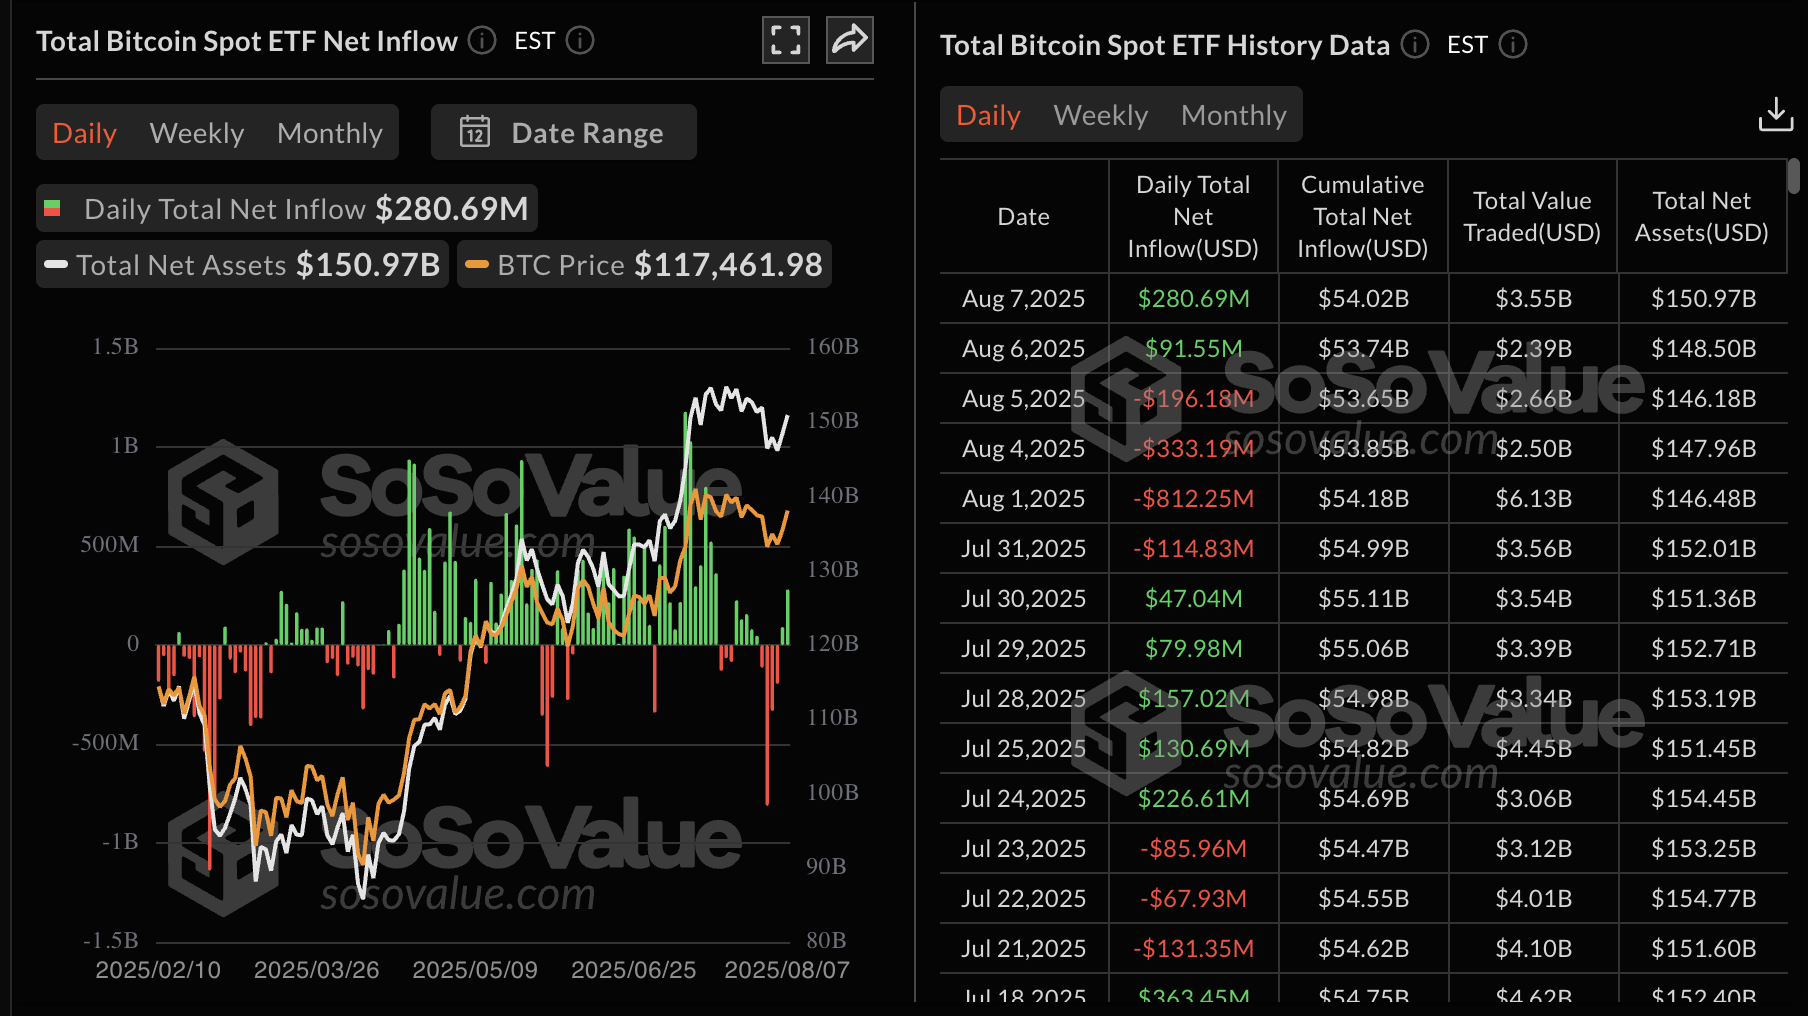
Bitcoin spot ETF data | Source: SoSoValue
Ethereum spot ETFs marked the third consecutive day of inflows with $222 million streaming in on Thursday. The cumulative total net inflow averages $9.35 billion, with net assets around $21.8 billion.
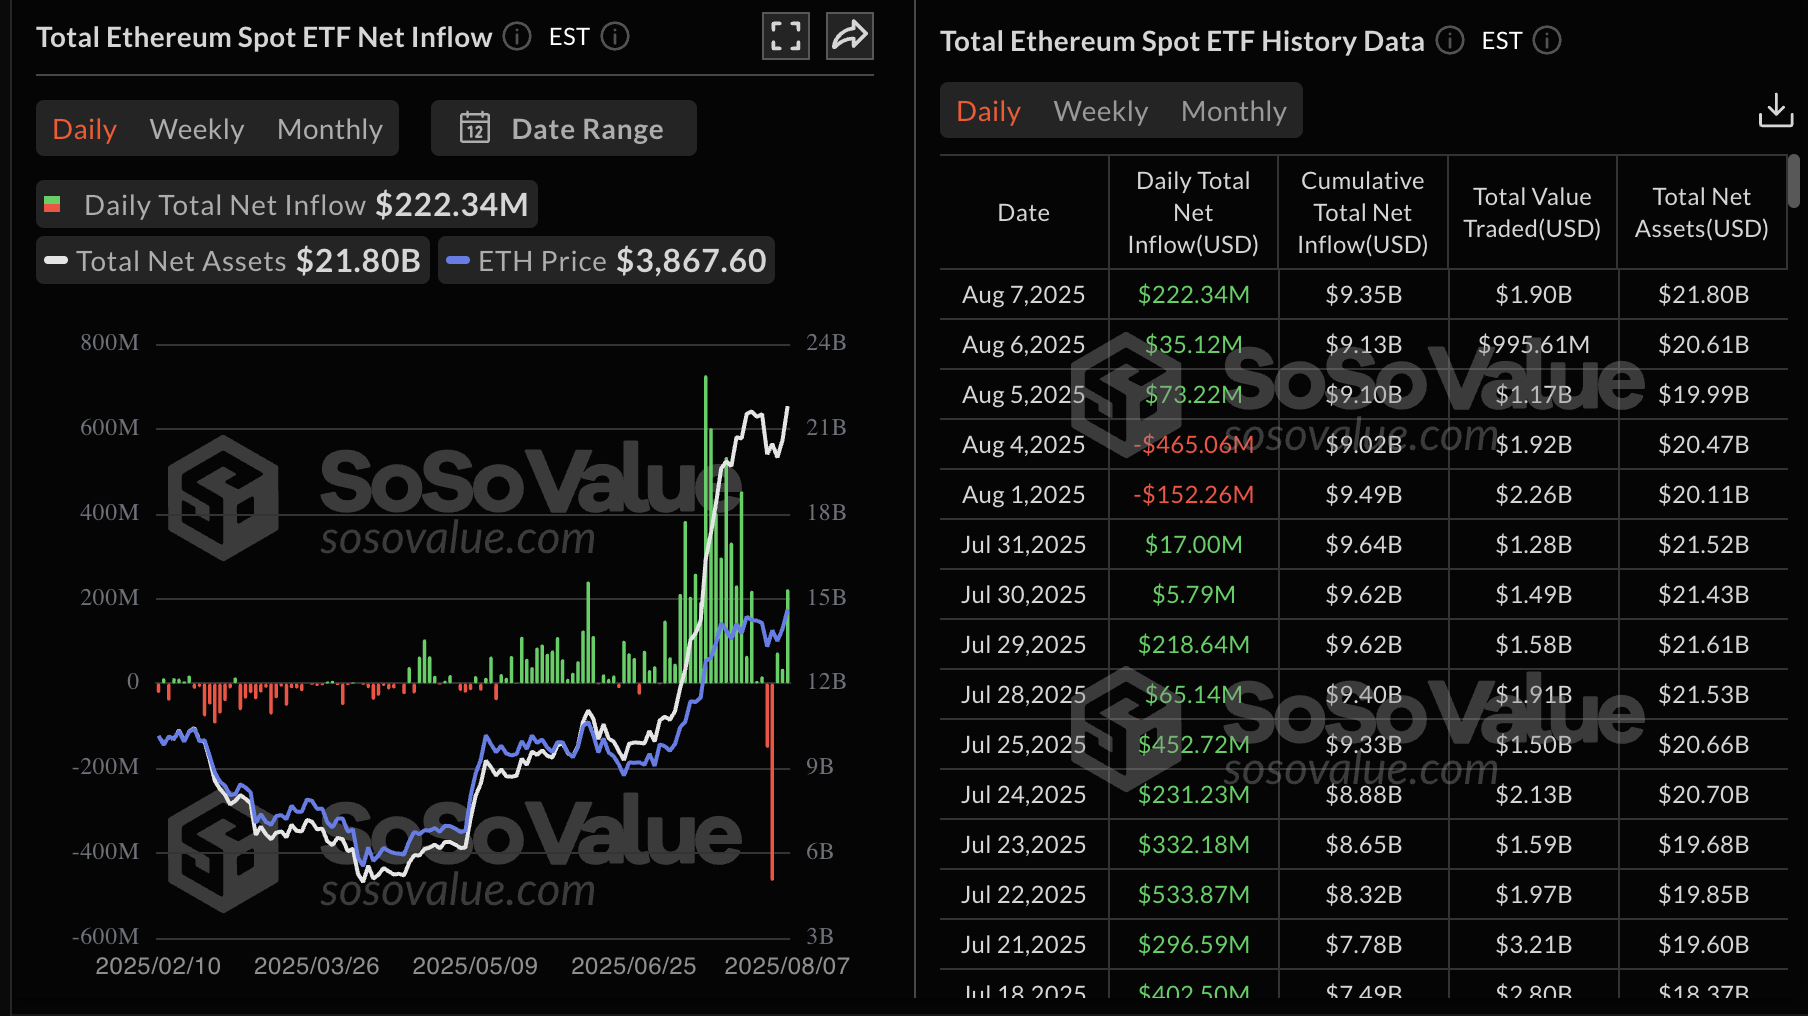
Ethereum spot ETF data | Source: SoSoValue
If the risk appetite for digital assets steadies over the next few weeks, Bitcoin and Ethereum could break previous records to achieve net positive monthly returns in August.
Glassnode on-chain data shows that wallets holding less than 100 BTC have not slowed their uptake despite price fluctuations. Currently, monthly balance growth stands at over 17,000 BTC, exceeding the more than 13,850 BTC mined per month. This cohort of wallets, also referred to as Shrimp-to-Fish, accounts for 10,000 BTC purchased, underscoring the growth in retail accumulation.
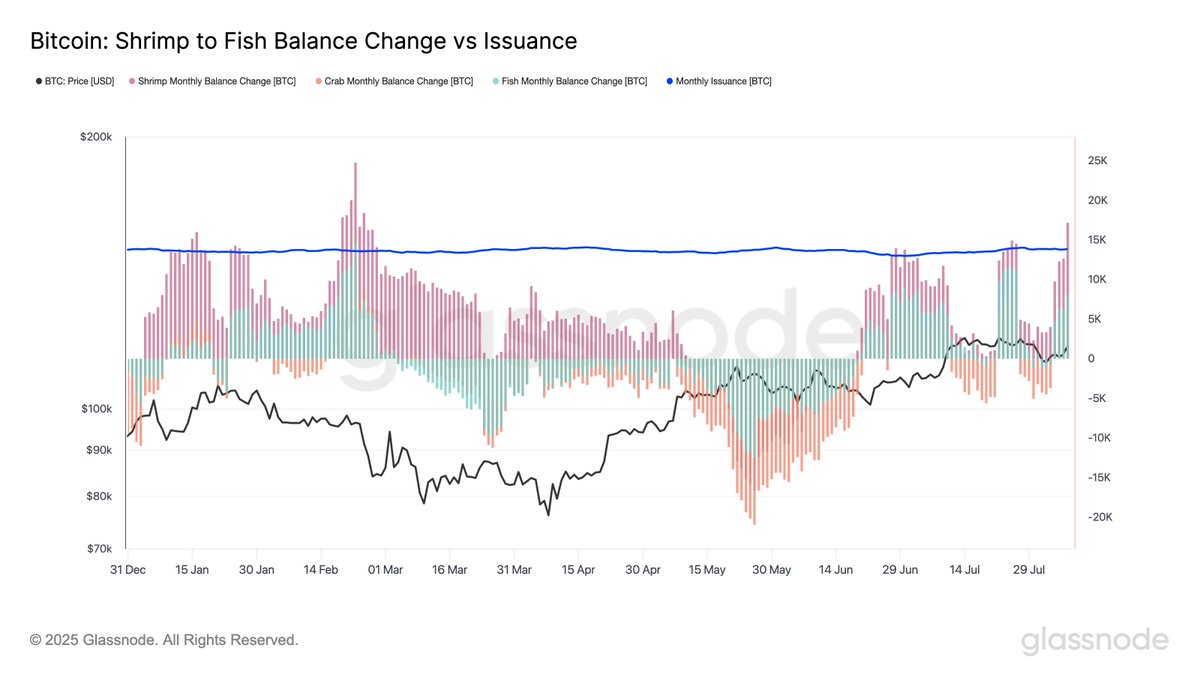
Bitcoin Shrimp-to-Fish Balance vs Issuance | Source: Glassnode
Chart of the day: Bitcoin uptrend stalls
Bitcoin price recovery is taking a breather after breaking above $117,000 and approaching the round-number resistance at $118,000. As observed on the daily chart, BTC is printing the first daily red candle after two consecutive days of gains.
This correction, potentially driven by profit taking, could result in another breakout, especially if the Moving Average Convergence Divergence (MACD) indicator triggers a buy signal with the blue line crossing above the red signal line. Such a signal would call on traders to increase exposure targeting highs around $118,000 and $120,000.
Still, traders should be cautious considering the Relative Strength Index (RSI) is reversing toward the midline after reaching a high of 56. A break below this neutral zone could encourage risk-off sentiment.
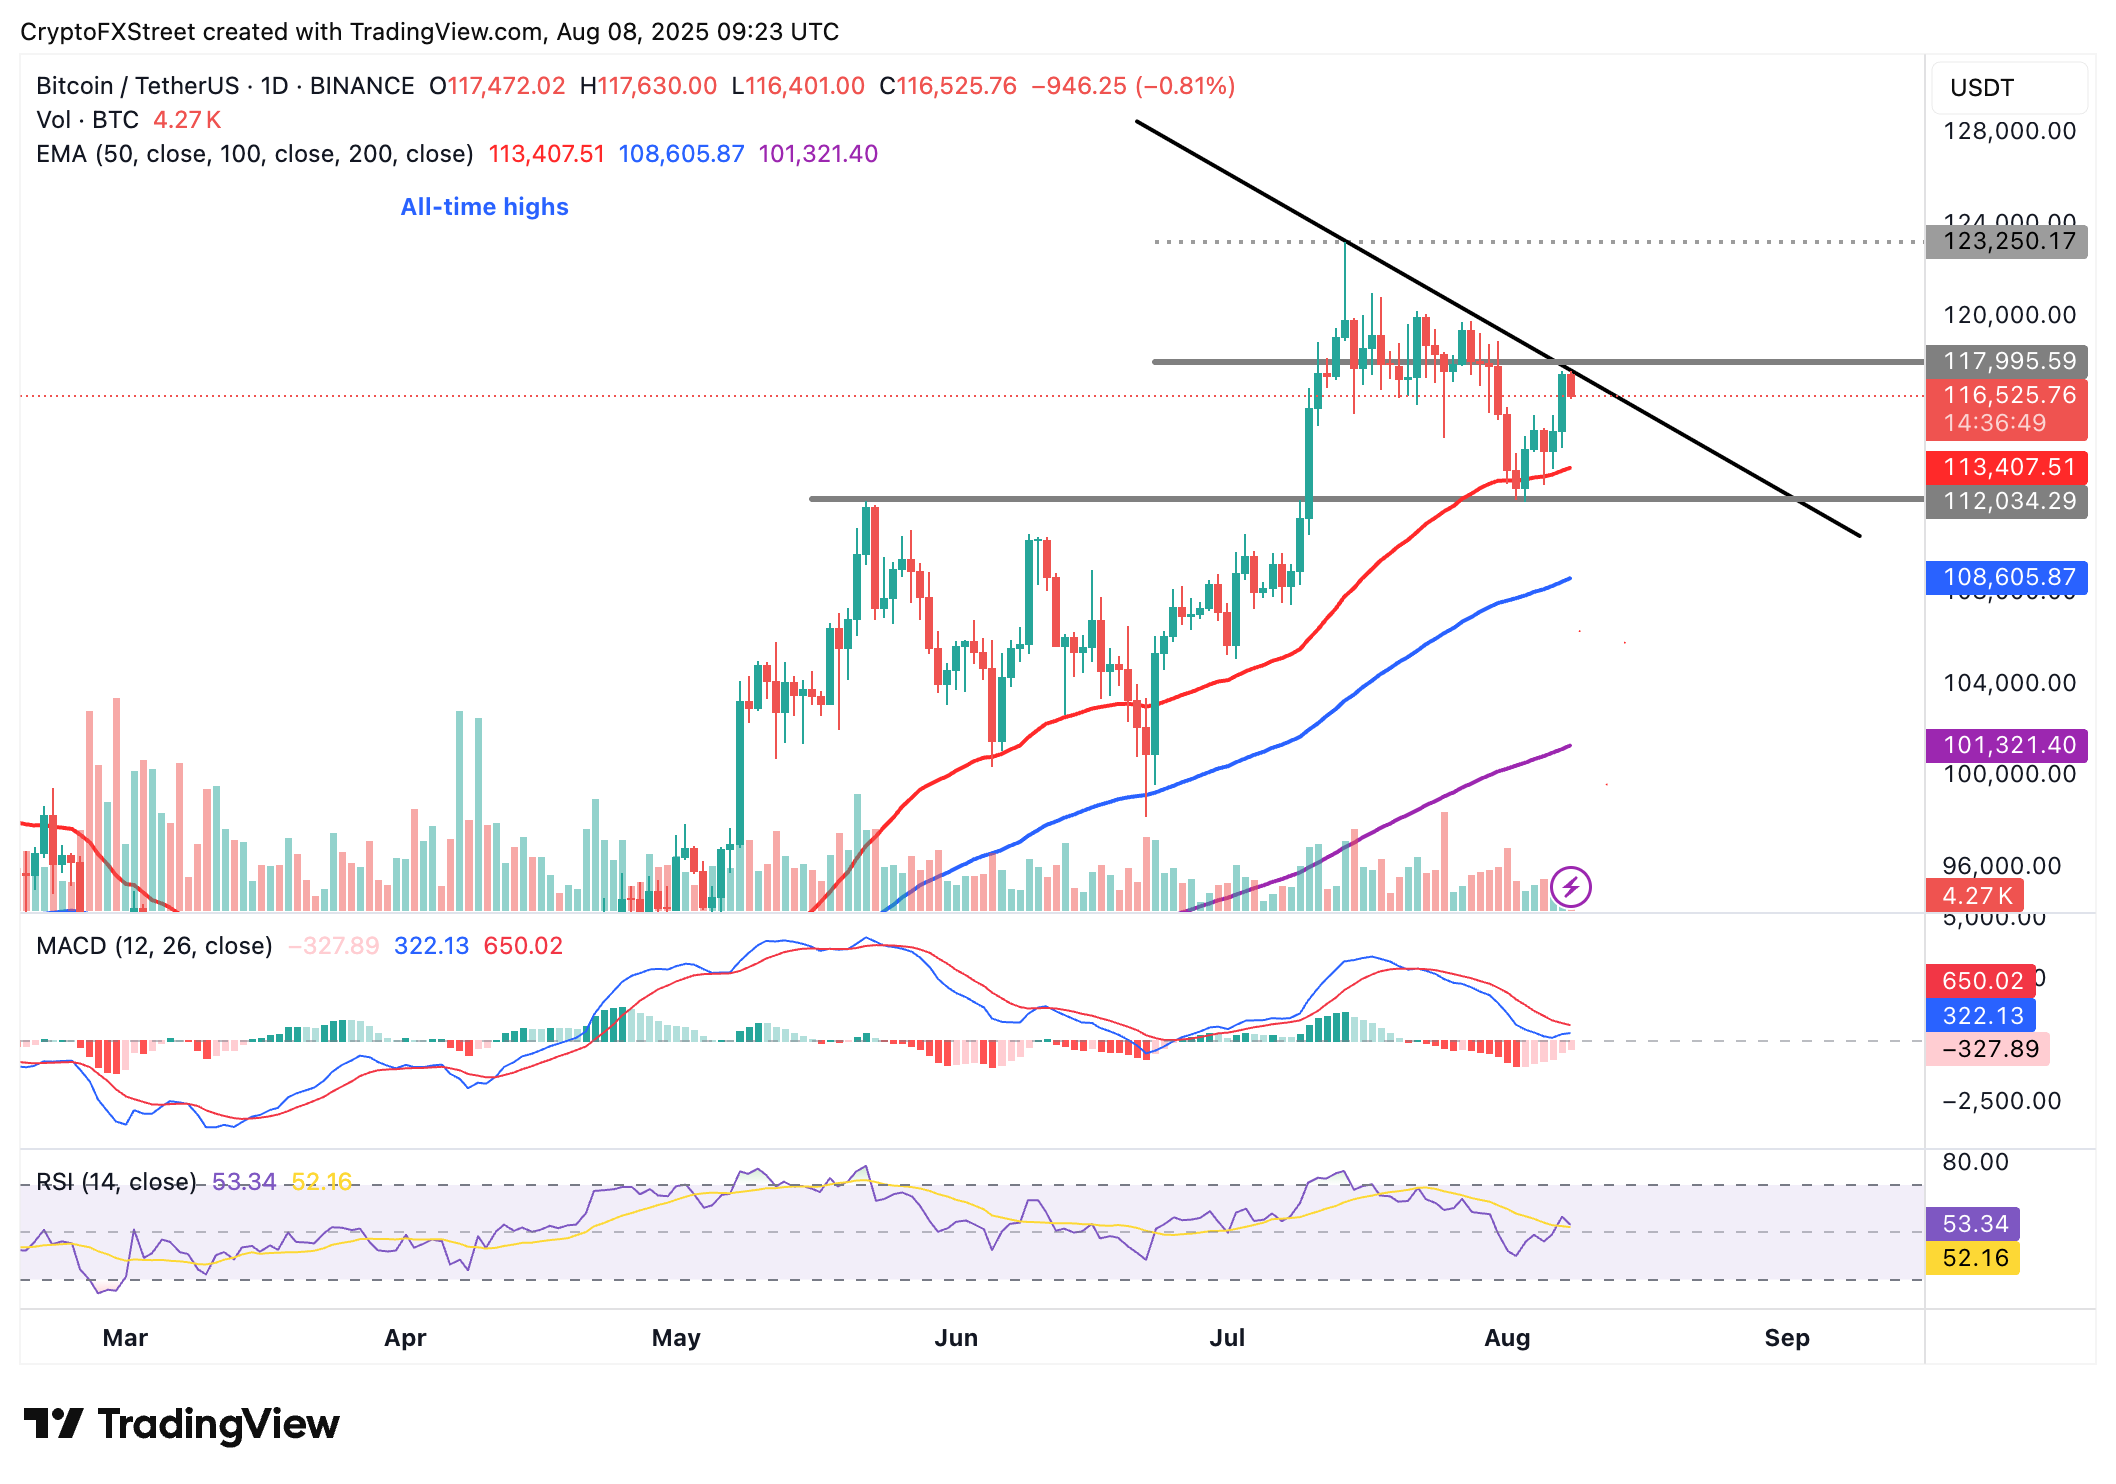
BTC/USDT daily chart
Altcoins update: Ethereum, XRP surge as bulls seize momentum
Ethereum price holds slightly above $3,900 at the time of writing, backed by positive market sentiment and the increase in speculative demand from both institutional and retail investors.
The smart contracts token also sits above key moving averages, including the 50-day Exponential Moving Average (EMA) at $3,266, the 100-day EMA at $2,936 and the 200-day EMA at $2,757, thus upholding the bullish structure.
The MACD indicator could confirm a buy signal if bulls retain the tight grip. If the blue MACD line crosses and settles above the red signal line, the path of least resistance will remain upward, increasing the chances of the price of ETH breaking the $4,000 mark.
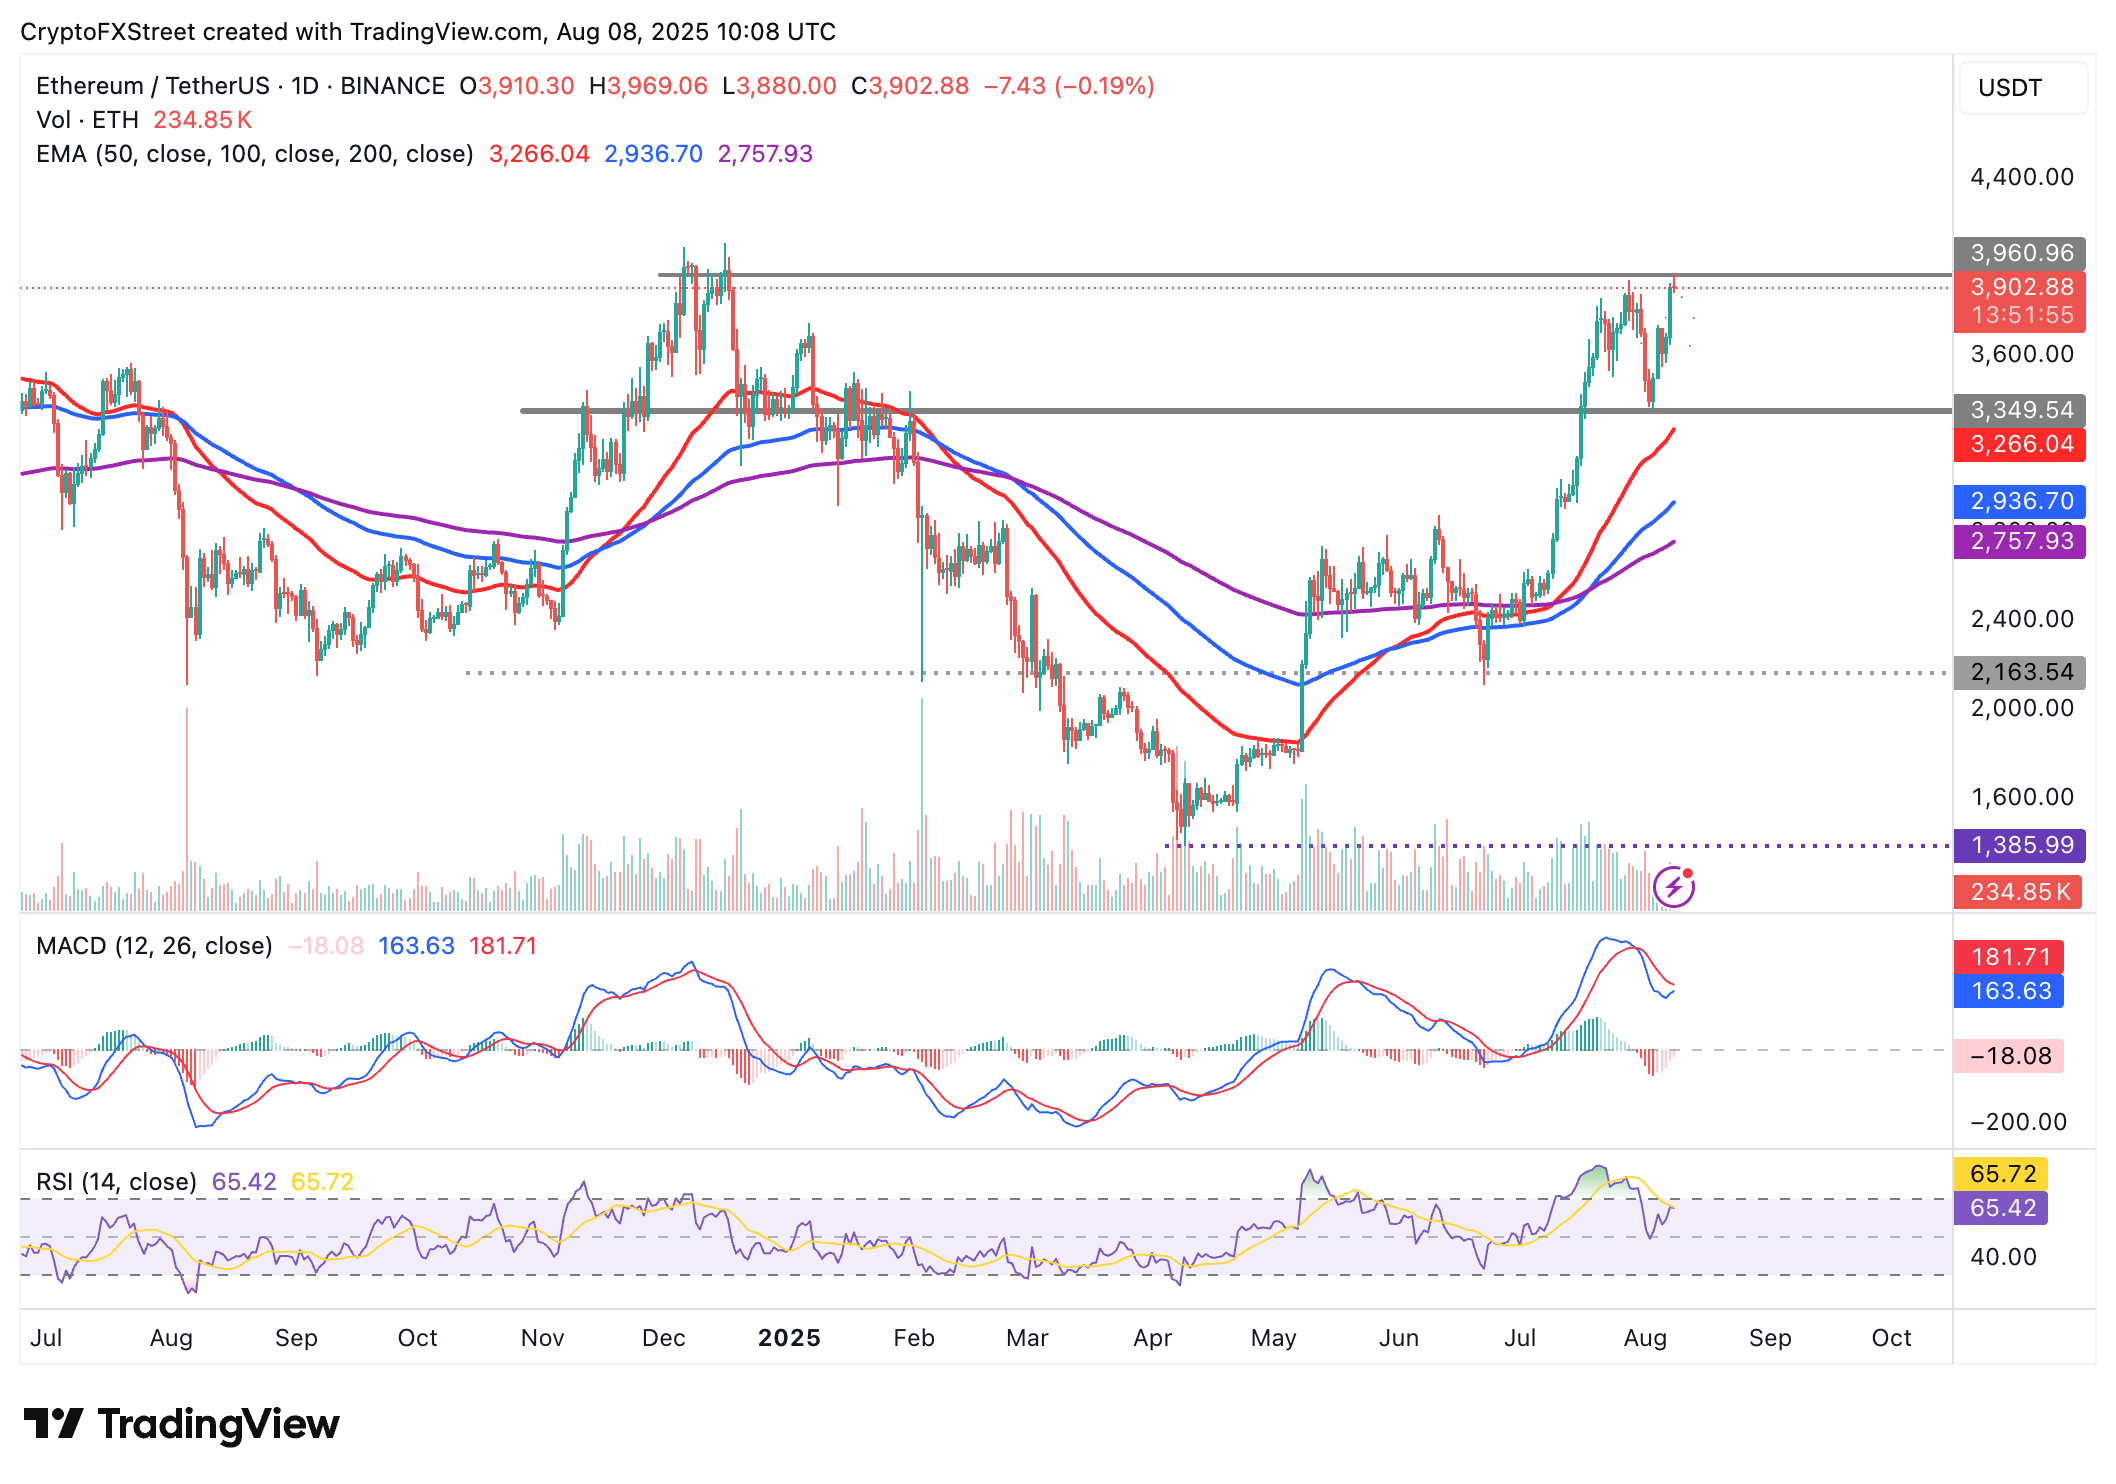
ETH/USD daily chart
As for XRP, bulls are largely in control with the MACD indicator likely to confirm a buy signal on the daily chart. The resistance at $3.40 currently caps price movement. Breaching this seller congestion could clear the path for the price of XRP to extend the uptrend toward its record high of $3.66 reached on July 18.
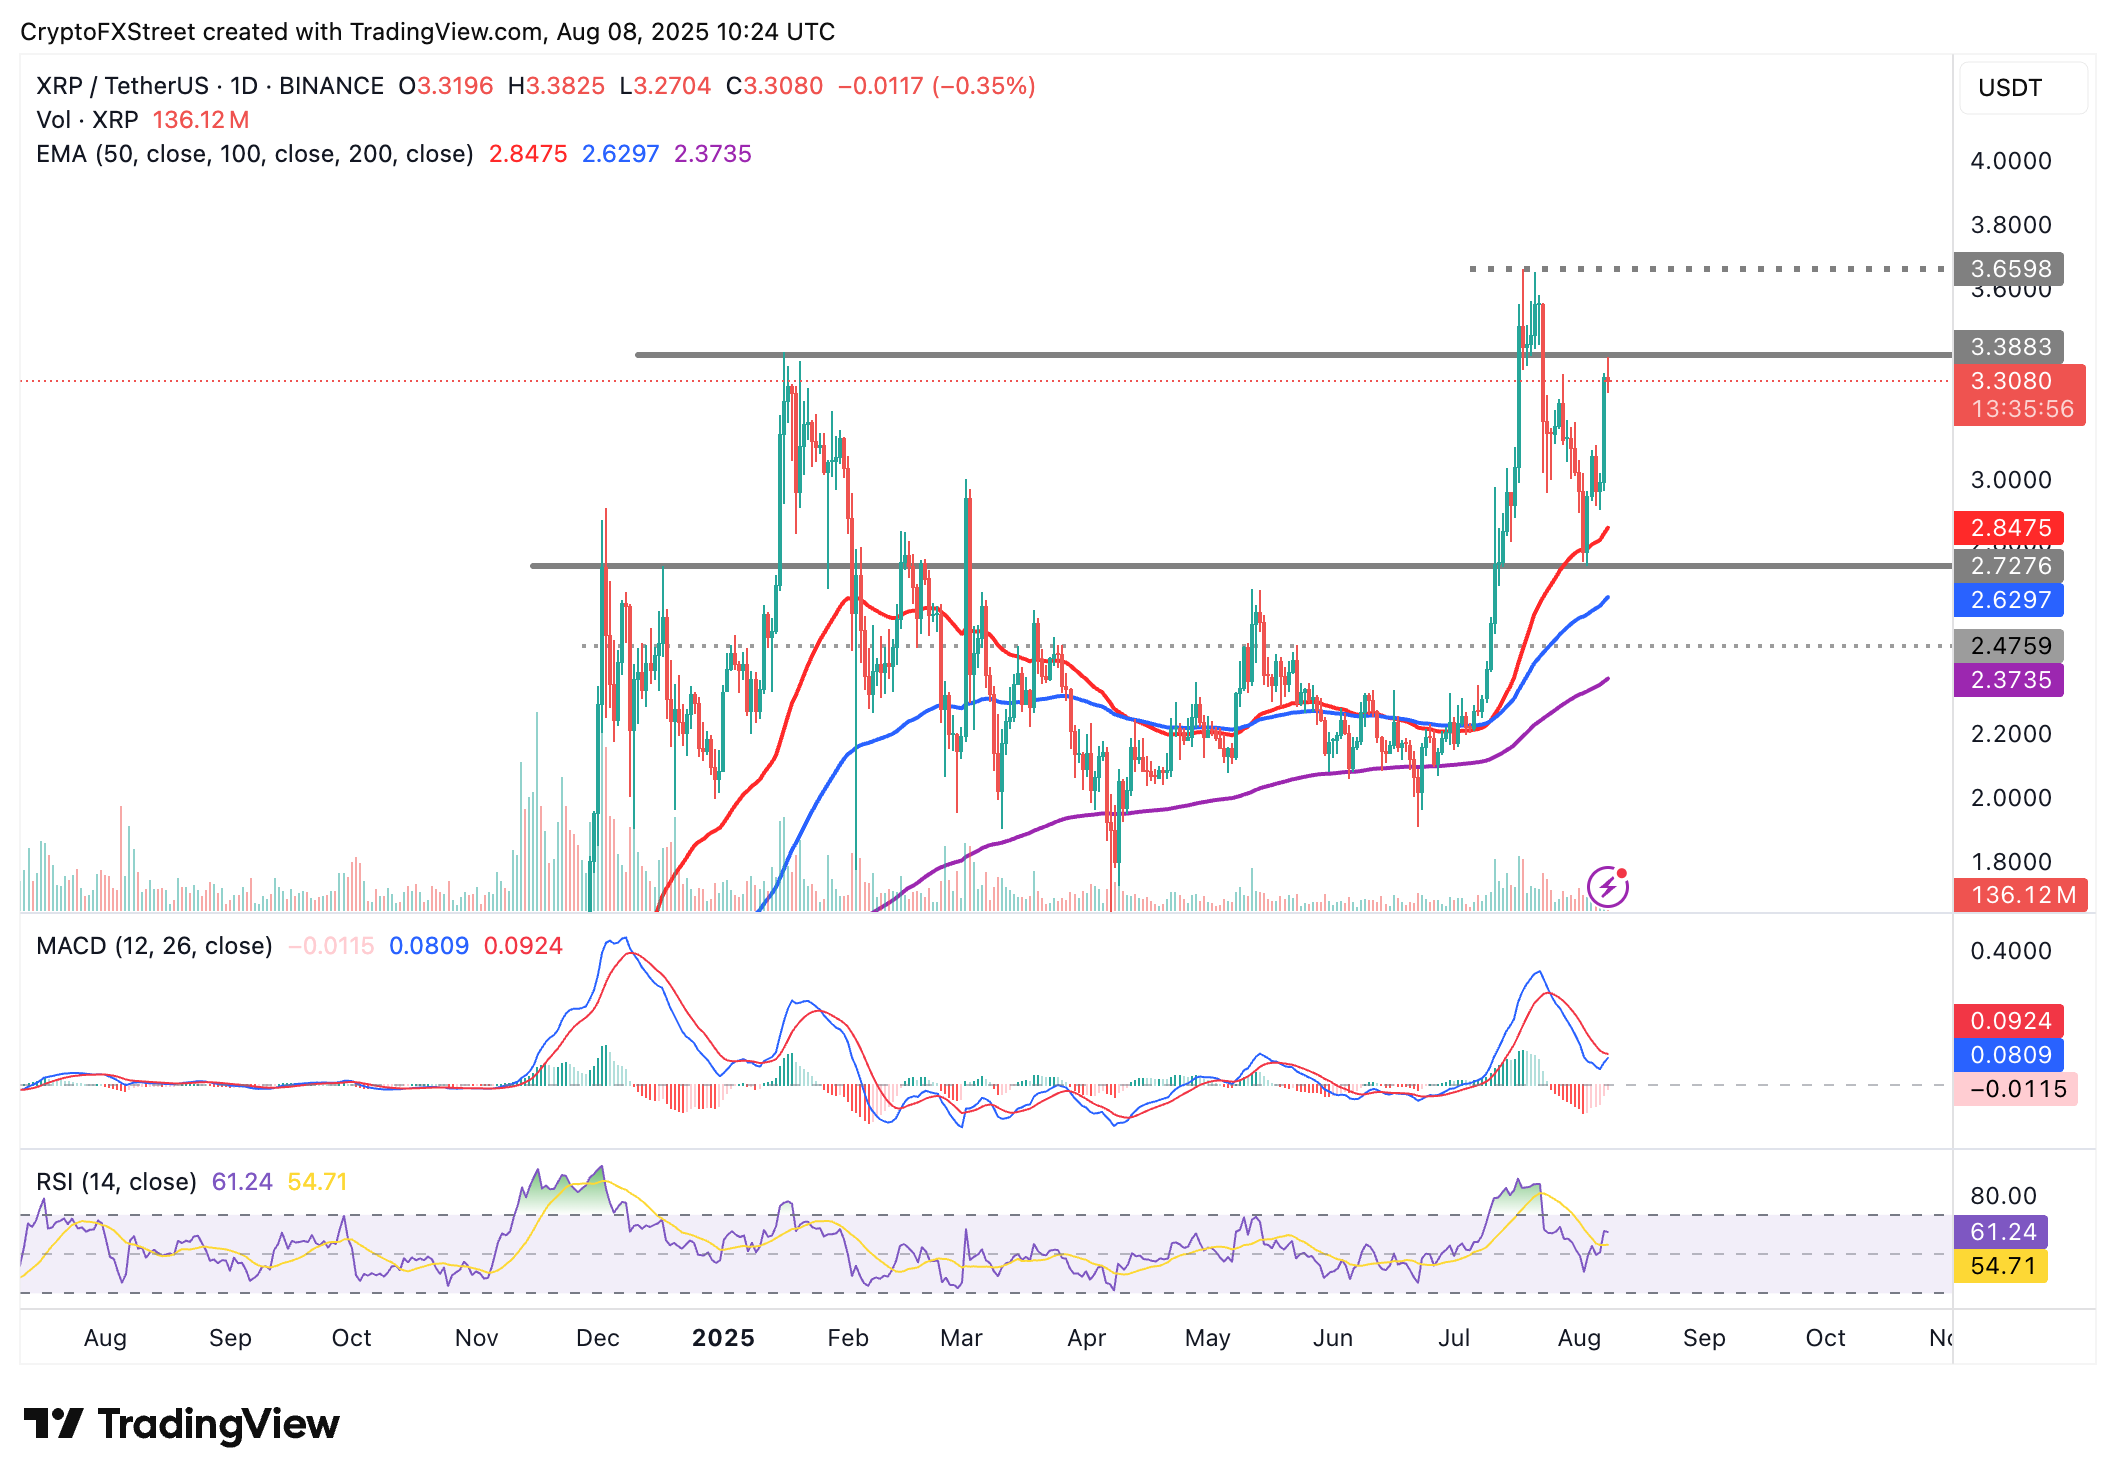
XRP/USDT daily chart
The RSI is in the bullish zone above the midline but stabilising at around 61. Traders may want to monitor the RSI to gauge the level of buying pressure, with continued movement toward overbought territory affirming the bullish grip. On the other hand, reversal toward the midline could hint at profit-taking as buying pressure fades.