

- Bitcoin price hovers around $109,000 on Friday after falling nearly 5% so far this week.
- The cryptocurrency market saw its largest single-day liquidation so far this year, wiping out billions in long positions.
- The Fed’s cautious stance and rising geopolitical conflicts trigger a risk-off sentiment in the market.
Bitcoin (BTC) price hovers around $109,000 at the time of writing on Friday after shedding nearly 5% so far this week. The broader cryptocurrency market experienced its largest single-day liquidation event of the year, wiping out mostly long positions. The broader outlook remains fragile as the Federal Reserve’s (Fed) cautious stance on rate cuts and escalating geopolitical conflicts dampen risk appetite.
Wave of liquidations
Bitcoin price started the week on a negative note, falling more than 2% on Monday. This sudden price drop triggered the largest single-day liquidation in the broad crypto market so far this year, with $1.65 billion in long positions wiped out compared to just $145.83 million in shorts, highlighting excessive bullishness among traders.
Following the massive liquidations on Monday, sour market conditions have persisted throughout the week, with BTC dropping below $109,000, triggering another round of sell-offs on Thursday that wiped out more than $1.09 billion in long positions.
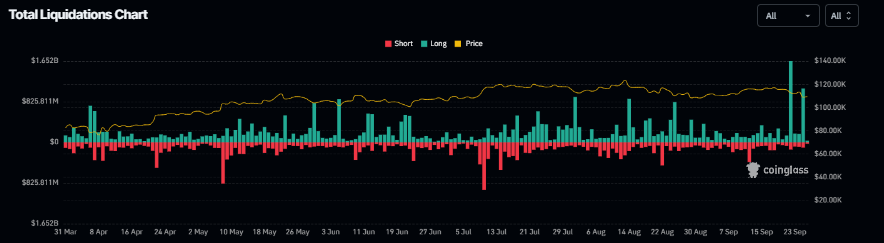
Total Liquidations chart. Source: Coinglass
The Fear and Greed Index fell to 28 on Friday, the lowest value since mid-April following the recent price drop, indicating growing caution and a tilt toward fear among market participants.
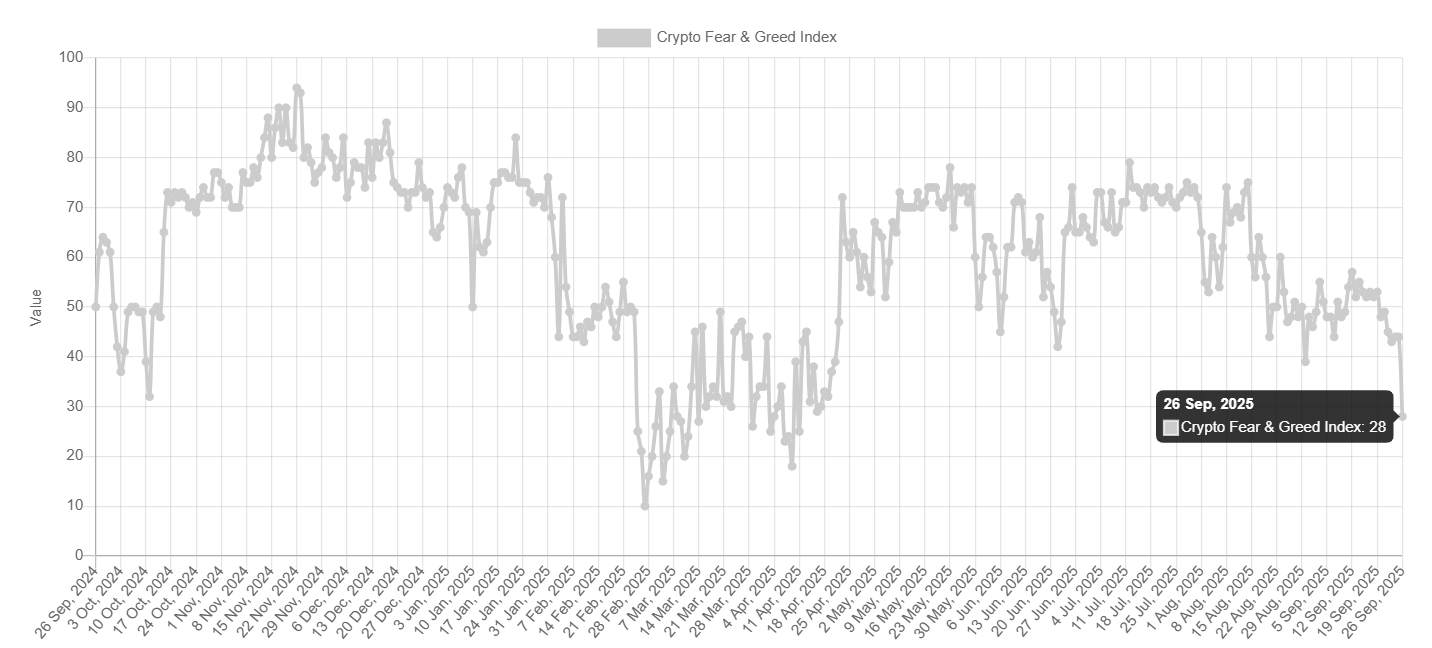
Crypto Fear & Greed Index chart. Source: Alternative.me
Bitcoin leverage nears yearly peak
Despite the liquidations, CryptoQuant’s BTC Estimated Leverage Ratio (ELR) stood at 0.285 on Friday, close to its yearly peak of 0.291 recorded on September 11, yet still well below the record high of 0.358 in 2011, suggesting that traders remain moderately leveraged but not excessively overexposed.
-1758876476440-1758876476441.png)
Bitcoin ELR chart. Source: CryptoQuant
Fed’s cautious stance fueled BTC drop
Bitcoin price correction this week was fueled by the Federal Reserve’s (Fed) cautious stance and rising geopolitical conflicts, which triggered a risk-off sentiment in the markets.
After a 25 basis point (bps) interest rate cut last week, Fed Chair Jerome Powell tried to push back expectations of more rate cuts in the coming months and said, on Tuesday, that the central bank needed to continue balancing the competing risks of high inflation and a weakening job market in coming rate decisions.
Powell added that easing too aggressively could leave the inflation task unfinished and would necessitate a reversal of course. This helps revive demand for the US Dollar (USD), while risk assets such as cryptos continue to slide.
Adding to this cautious Fed stance, the ongoing geopolitical conflicts, such as the Russia-Ukraine war and Israel’s continuing military operations across Gaza, contribute to bearish sentiment in the cryptomarket.
The “September effect” still weighs on Bitcoin
CoinGlass’s historical monthly return data shows that September has generally delivered negative returns for Bitcoin, averaging -3.39%. While BTC is up 1.17% so far this month, traders should remain cautious as history suggests the month could still close in the red.
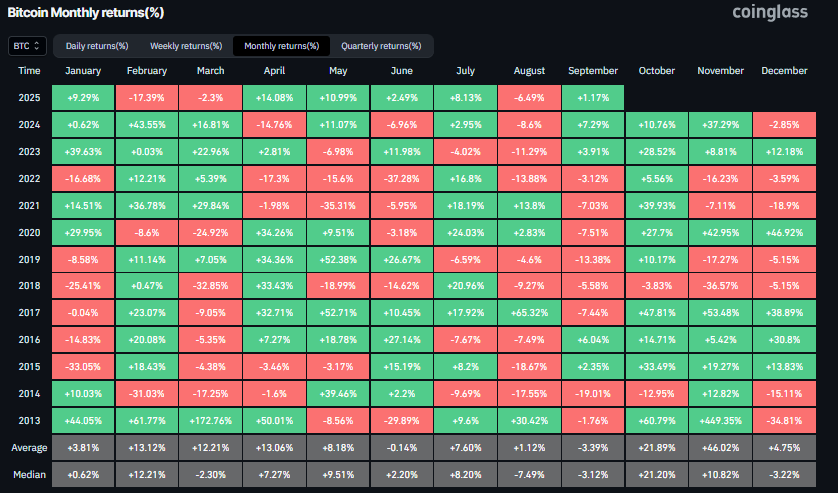
Bitcoin Monthly return (%) chart. Source: Coinglass
Weakening institutional demand for Bitcoin
Bitcoin price correction was fueled by weakening institutional demand this week. According to SoSoValue data, as shown below, Bitcoin spot Exchange Traded Funds (ETFs) recorded a total of $484.24 million outflows as of Thursday, breaking the four-week-long streak of positive flows since the end of August. If this outflow continues and intensifies, BTC could experience further correction ahead.
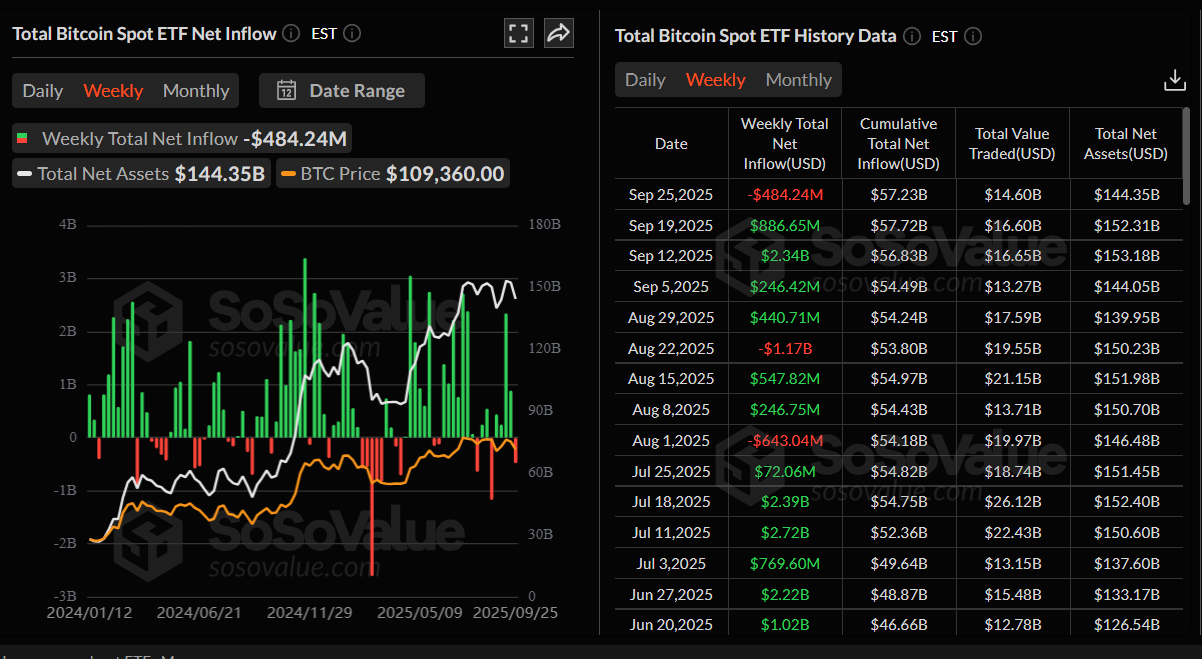
Total Bitcoin spot ETF net inflow chart. Source: SoSoValue
Some signs of optimism
Despite the recent price drop, corporate demand remains strong. Strategy announced on Monday that the firm had added 850 BTC to its reserve, bringing its total holdings to 639,835.

During the same period, Japanese investment firm Metaplanet announced that it had purchased an additional 5,419 BTC, bringing the total holding to 25,555 BTC. Moreover, Europe’s First Bitcoin Treasury Company, Capital B, also added 551 BTC to its treasury reserves, now holding a total of 2,800 BTC.
Apart from corporate buying BTC dips, the US Senate Finance Committee has scheduled a hearing to examine the taxation of crypto assets for October 1.
Chairman Mike Crapo announced on Wednesday that the Committee will convene for a hearing entitled “Examining the Taxation of Digital Assets”.
This announcement could be a positive development for cryptocurrencies in the US, as it provides more regulatory clarity regarding the setting of tax rules for digital assets and could attract wider adoption of crypto in the country.
What’s next for BTC?
Bitcoin price on the weekly chart showed that, after facing a slight rejection around $118,000 last week, BTC fell nearly 5%, trading at around $109,500 on Friday.
If BTC continues its correction, it could extend the decline toward July’s low around $107,429. A decisive close below this level could extend the losses to retest the weekly support at $104,463.
The Relative Strength Index (RSI) on the weekly chart reads 52, pointing downward to the neutral level of 50, indicating fading bullish momentum. If the RSI slips below the neutral level, BTC could extend the recent losses.
Meanwhile, the Moving Average Convergence Divergence (MACD) indicator on the weekly chart showed a bearish crossover in mid-August, which remains in effect. The rising red histogram bars below the neutral level also suggest a bearish momentum and continuation of the downward trend.
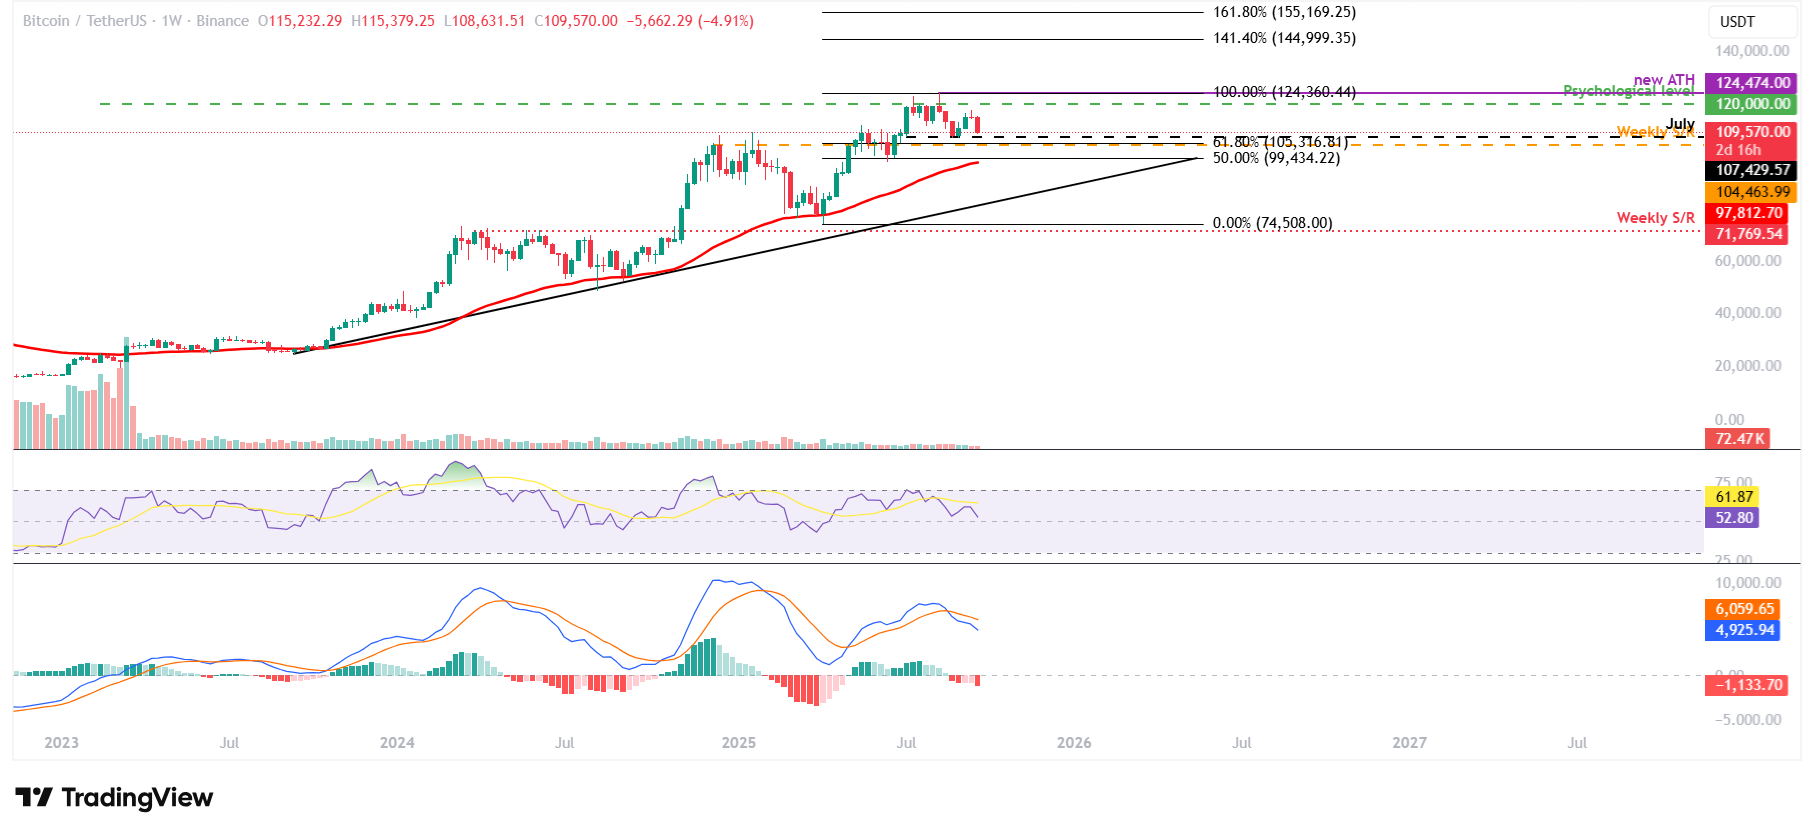
BTC/USDT weekly chart
On the daily chart, Bitcoin price failed to find support around the daily level of $116,000 on September 19 and declined 3.19% over the next four days, closing below the 50-day Exponential Moving Average at $113,488 on Monday. BTC recovered slightly on Wednesday, but failed to close above the 50-day EMA and declined 3.81% the next day, closing below the ascending trendline (drawn by connecting multiple lows since early May). At the time of writing on Friday, it trades at around $109,500.
If BTC continues to correct, it could extend the decline toward the daily support at $107,245, which coincides with July’s low as reported above.
The Relative Strength Index (RSI) on the daily chart reads 38, below its neutral level of 50, indicating bearish momentum. Meanwhile, the Moving Average Convergence Divergence (MACD) indicator showed a bearish crossover on Monday, giving a sell signal, which is still in effect. Moreover, the rising red histogram bars below the neutral level also suggest a bearish momentum and continuation of the downward trend.
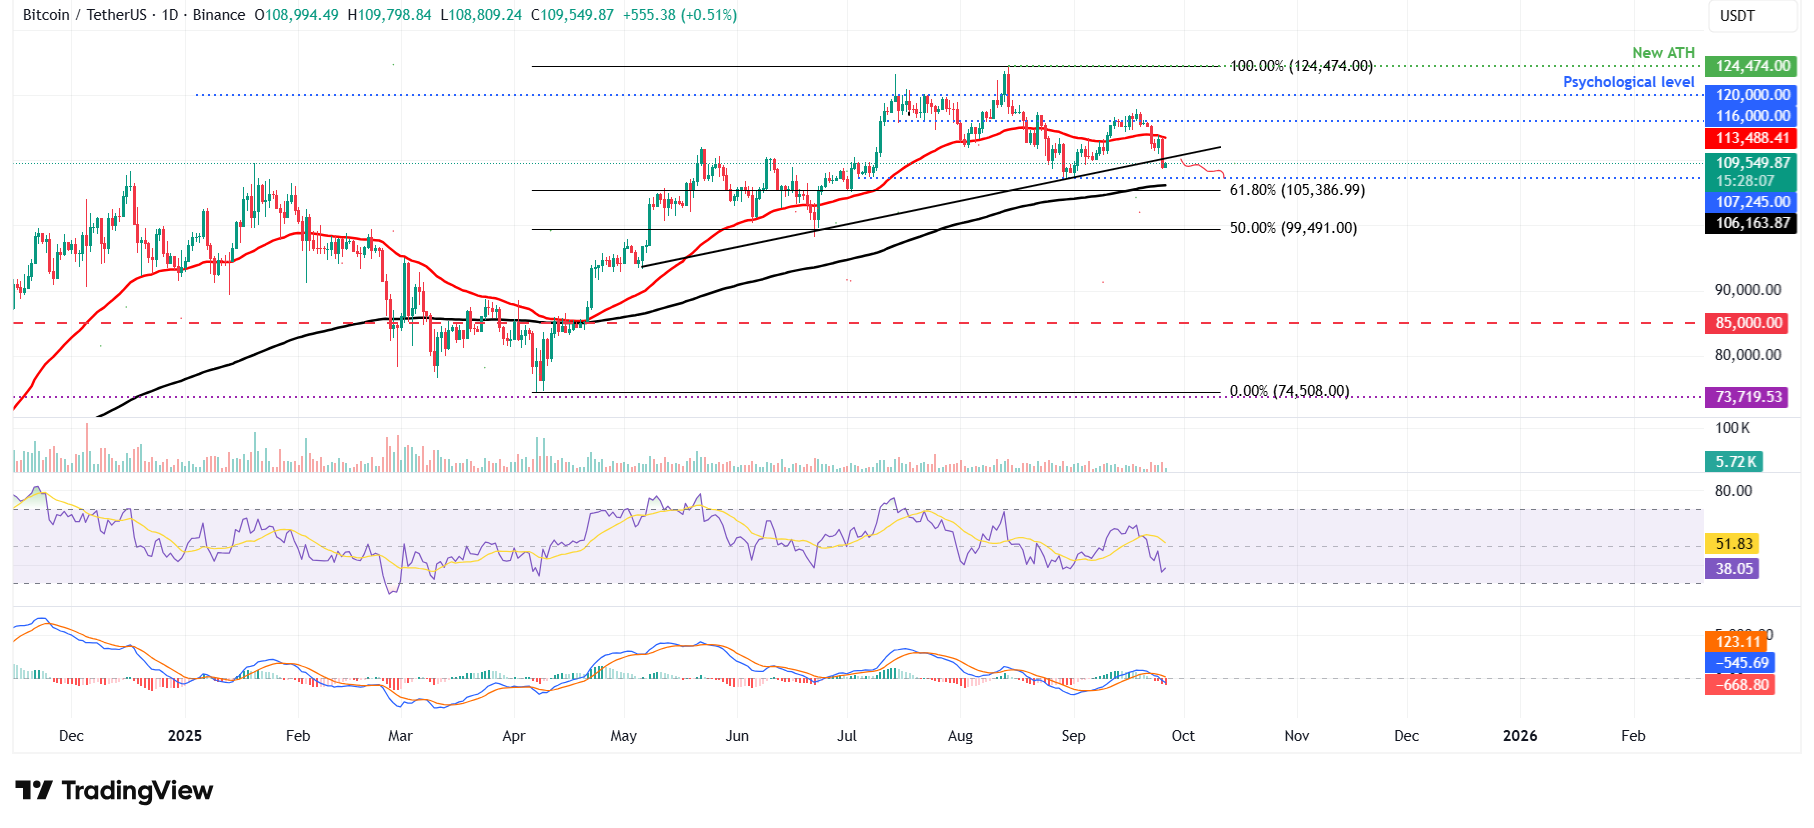
BTC/USDT daily chart
However, if BTC recovers, it could extend the rally toward the 50-day EMA at $113,488.
Bitcoin, altcoins, stablecoins FAQs
Bitcoin is the largest cryptocurrency by market capitalization, a virtual currency designed to serve as money. This form of payment cannot be controlled by any one person, group, or entity, which eliminates the need for third-party participation during financial transactions.
Altcoins are any cryptocurrency apart from Bitcoin, but some also regard Ethereum as a non-altcoin because it is from these two cryptocurrencies that forking happens. If this is true, then Litecoin is the first altcoin, forked from the Bitcoin protocol and, therefore, an “improved” version of it.
Stablecoins are cryptocurrencies designed to have a stable price, with their value backed by a reserve of the asset it represents. To achieve this, the value of any one stablecoin is pegged to a commodity or financial instrument, such as the US Dollar (USD), with its supply regulated by an algorithm or demand. The main goal of stablecoins is to provide an on/off-ramp for investors willing to trade and invest in cryptocurrencies. Stablecoins also allow investors to store value since cryptocurrencies, in general, are subject to volatility.
Bitcoin dominance is the ratio of Bitcoin’s market capitalization to the total market capitalization of all cryptocurrencies combined. It provides a clear picture of Bitcoin’s interest among investors. A high BTC dominance typically happens before and during a bull run, in which investors resort to investing in relatively stable and high market capitalization cryptocurrency like Bitcoin. A drop in BTC dominance usually means that investors are moving their capital and/or profits to altcoins in a quest for higher returns, which usually triggers an explosion of altcoin rallies.