

In brief
- Bitcoin climbed above $71,000 today, offering bulls their first glimpse of relief since February’s collapse.
- At the same time, the price move has formed the same compressive wedge pattern that preceded Bitcoin crashes in October 2025 and January 2026.
- On Myriad, traders are calling it a toss up on whether Bitcoin pumps to $84K or dumps to $55K first.
After a brutal February that took Bitcoin from the mid-$90,000s all the way down to a $59,000 low, the market finally has something to feel decent about. BTC is up roughly 4.65% today, trading around $71,013 and shaking off some of the fear that dominated the last several weeks.
The problem is, in doing so, Bitcoin has drawn an all too familiar pattern on its charts—and one that suggests a price crash could be in the cards.
The broader market, meanwhile, is still anticipating hard times. Stocks sunk to four-month lows after news of a delay to potential U.S.-Iran military strikes, pushing crypto alongside equities in a mild risk-on move. WTI crude dropped sharply, and the crypto market is once again in “extreme fear” territory, based on the Crypto Fear and Greed Index.
Despite this, some Bitcoin bulls believe this is a good time to buy, considering the last time Bitcoin had a similar spike was at the beginning of the month. So who’s right? Here’s what the charts say:
Bitcoin (BTC) price: by the numbers
Bitcoin is, indeed, having a nice start to the week: a 4.6% spike, going from $67,844 to a daily high of $71,811, before settling around its current price of $70,985. This movement is trying to break past the resistance of the average price of Bitcoin in the last 200 days, which is a real test of trend strength.
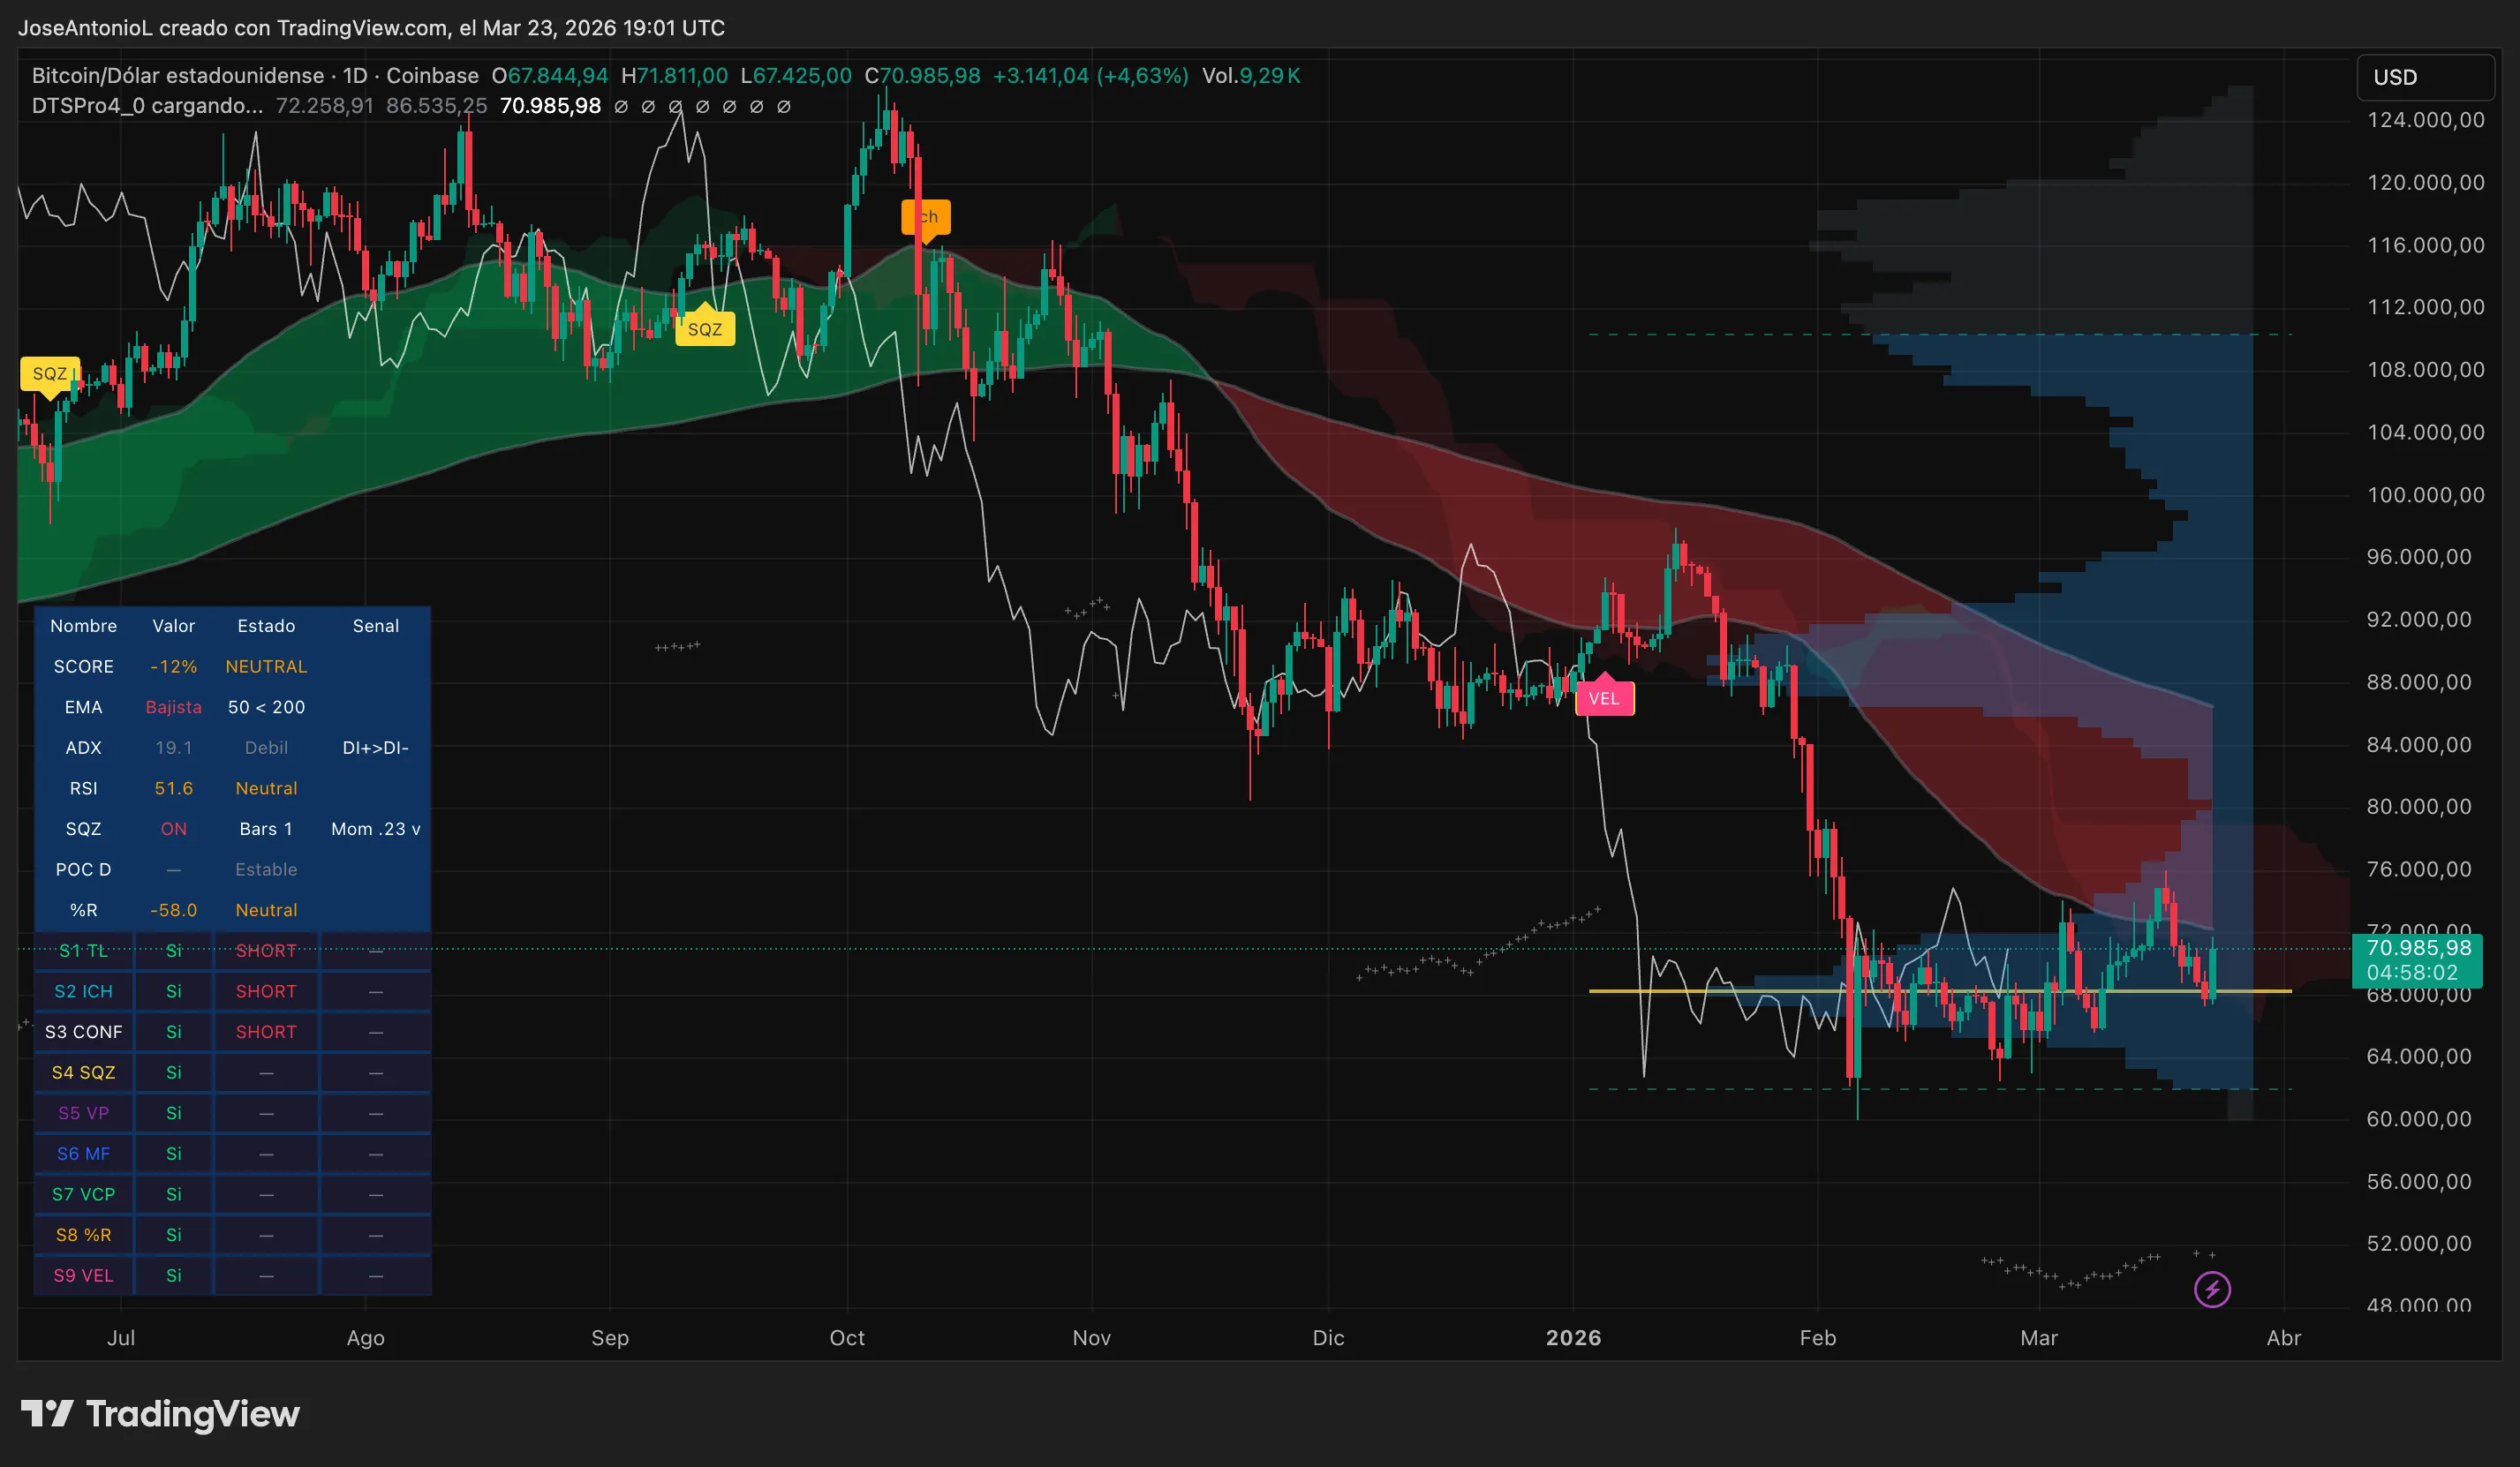
Dig deeper and the picture gets more nuanced. The ADX—the Average Directional Index, which measures how strong any trend actually is—sits at 19.1. That’s below 25, the threshold traders use to confirm a trend has real legs. At 19.1, it’s a sign of a weakening trend, which means bears are struggling to maintain the broader crash’s momentum.
The exponential moving averages, or EMAs, tell a similar story. The 50-day exponential moving average is still trading below the 200-day, which traders would interpret as the clearest signal of a bearish trend. Exponential moving averages smooth out price action over time to help identify where the price of an asset finds support or resistance. When the short-term average sits below the long-term one, it usually means the prevailing direction is still down, even during bounces.
The Relative Strength Index, or RSI, at 51.5 is also neutral. It is not screaming buy or sell, which makes sense. Bitcoin is in that in-between zone where it’s too early to celebrate and too soon to panic (again).
The Squeeze Momentum Indicator is on, with momentum reading a modest 0.26. This number tracks when a market is coiling up energy before a big move—like a spring being compressed or prices stabilizing after a major trend. It’s on right now, meaning the spring is loading. But with momentum still low, we haven’t seen a direction yet.
Fool me once…
Here’s what makes this moment more than a run-of-the-mill bounce: The chart is drawing a pattern it has now drawn twice before—and both times, it ended badly.
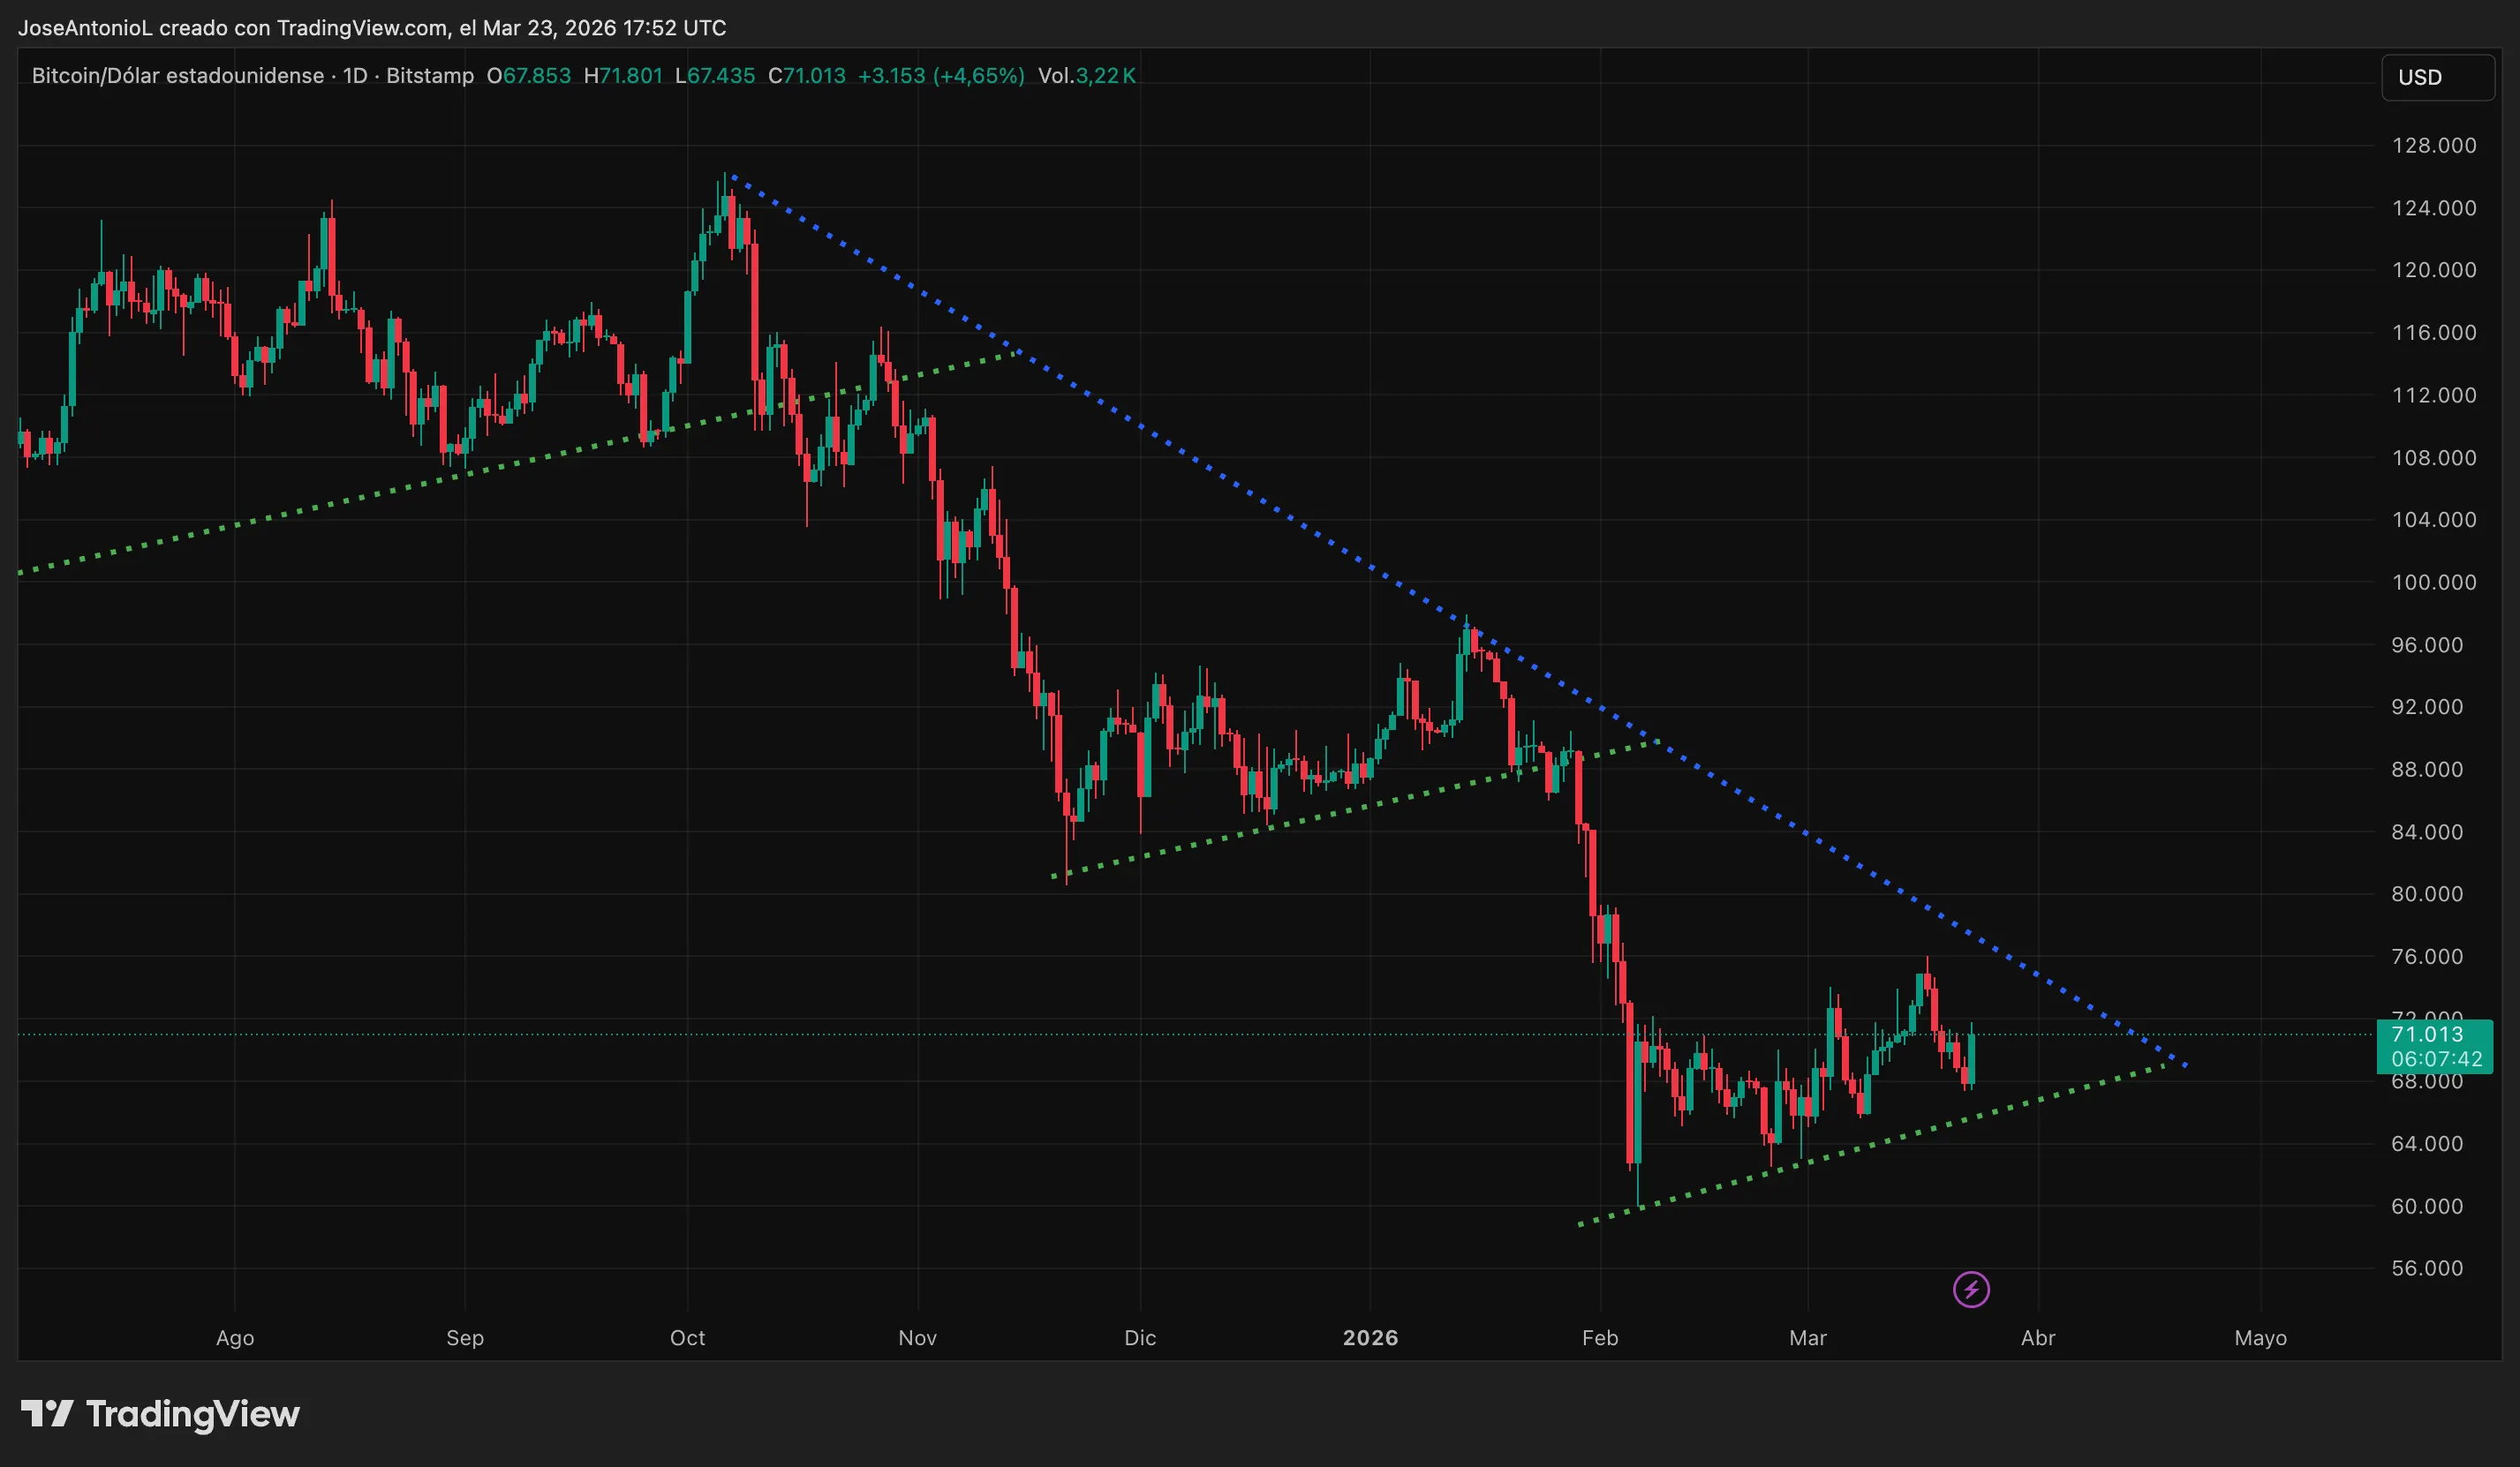
There’s a blue descending resistance line running from Bitcoin’s October 2025 peak, around $125,000, all the way down through the current price level. This is the roof. Bitcoin keeps trying to push up and the line keeps capping it. (That’s why it’s called a resistance.)
Below price action, there are three green dotted ascending lines, running parallel to each other. These are the supports. After each major crash, Bitcoin compresses: It bounces off the ascending green floor, climbs toward the blue ceiling line, and the range gets tighter and tighter until something breaks and the price crashes.
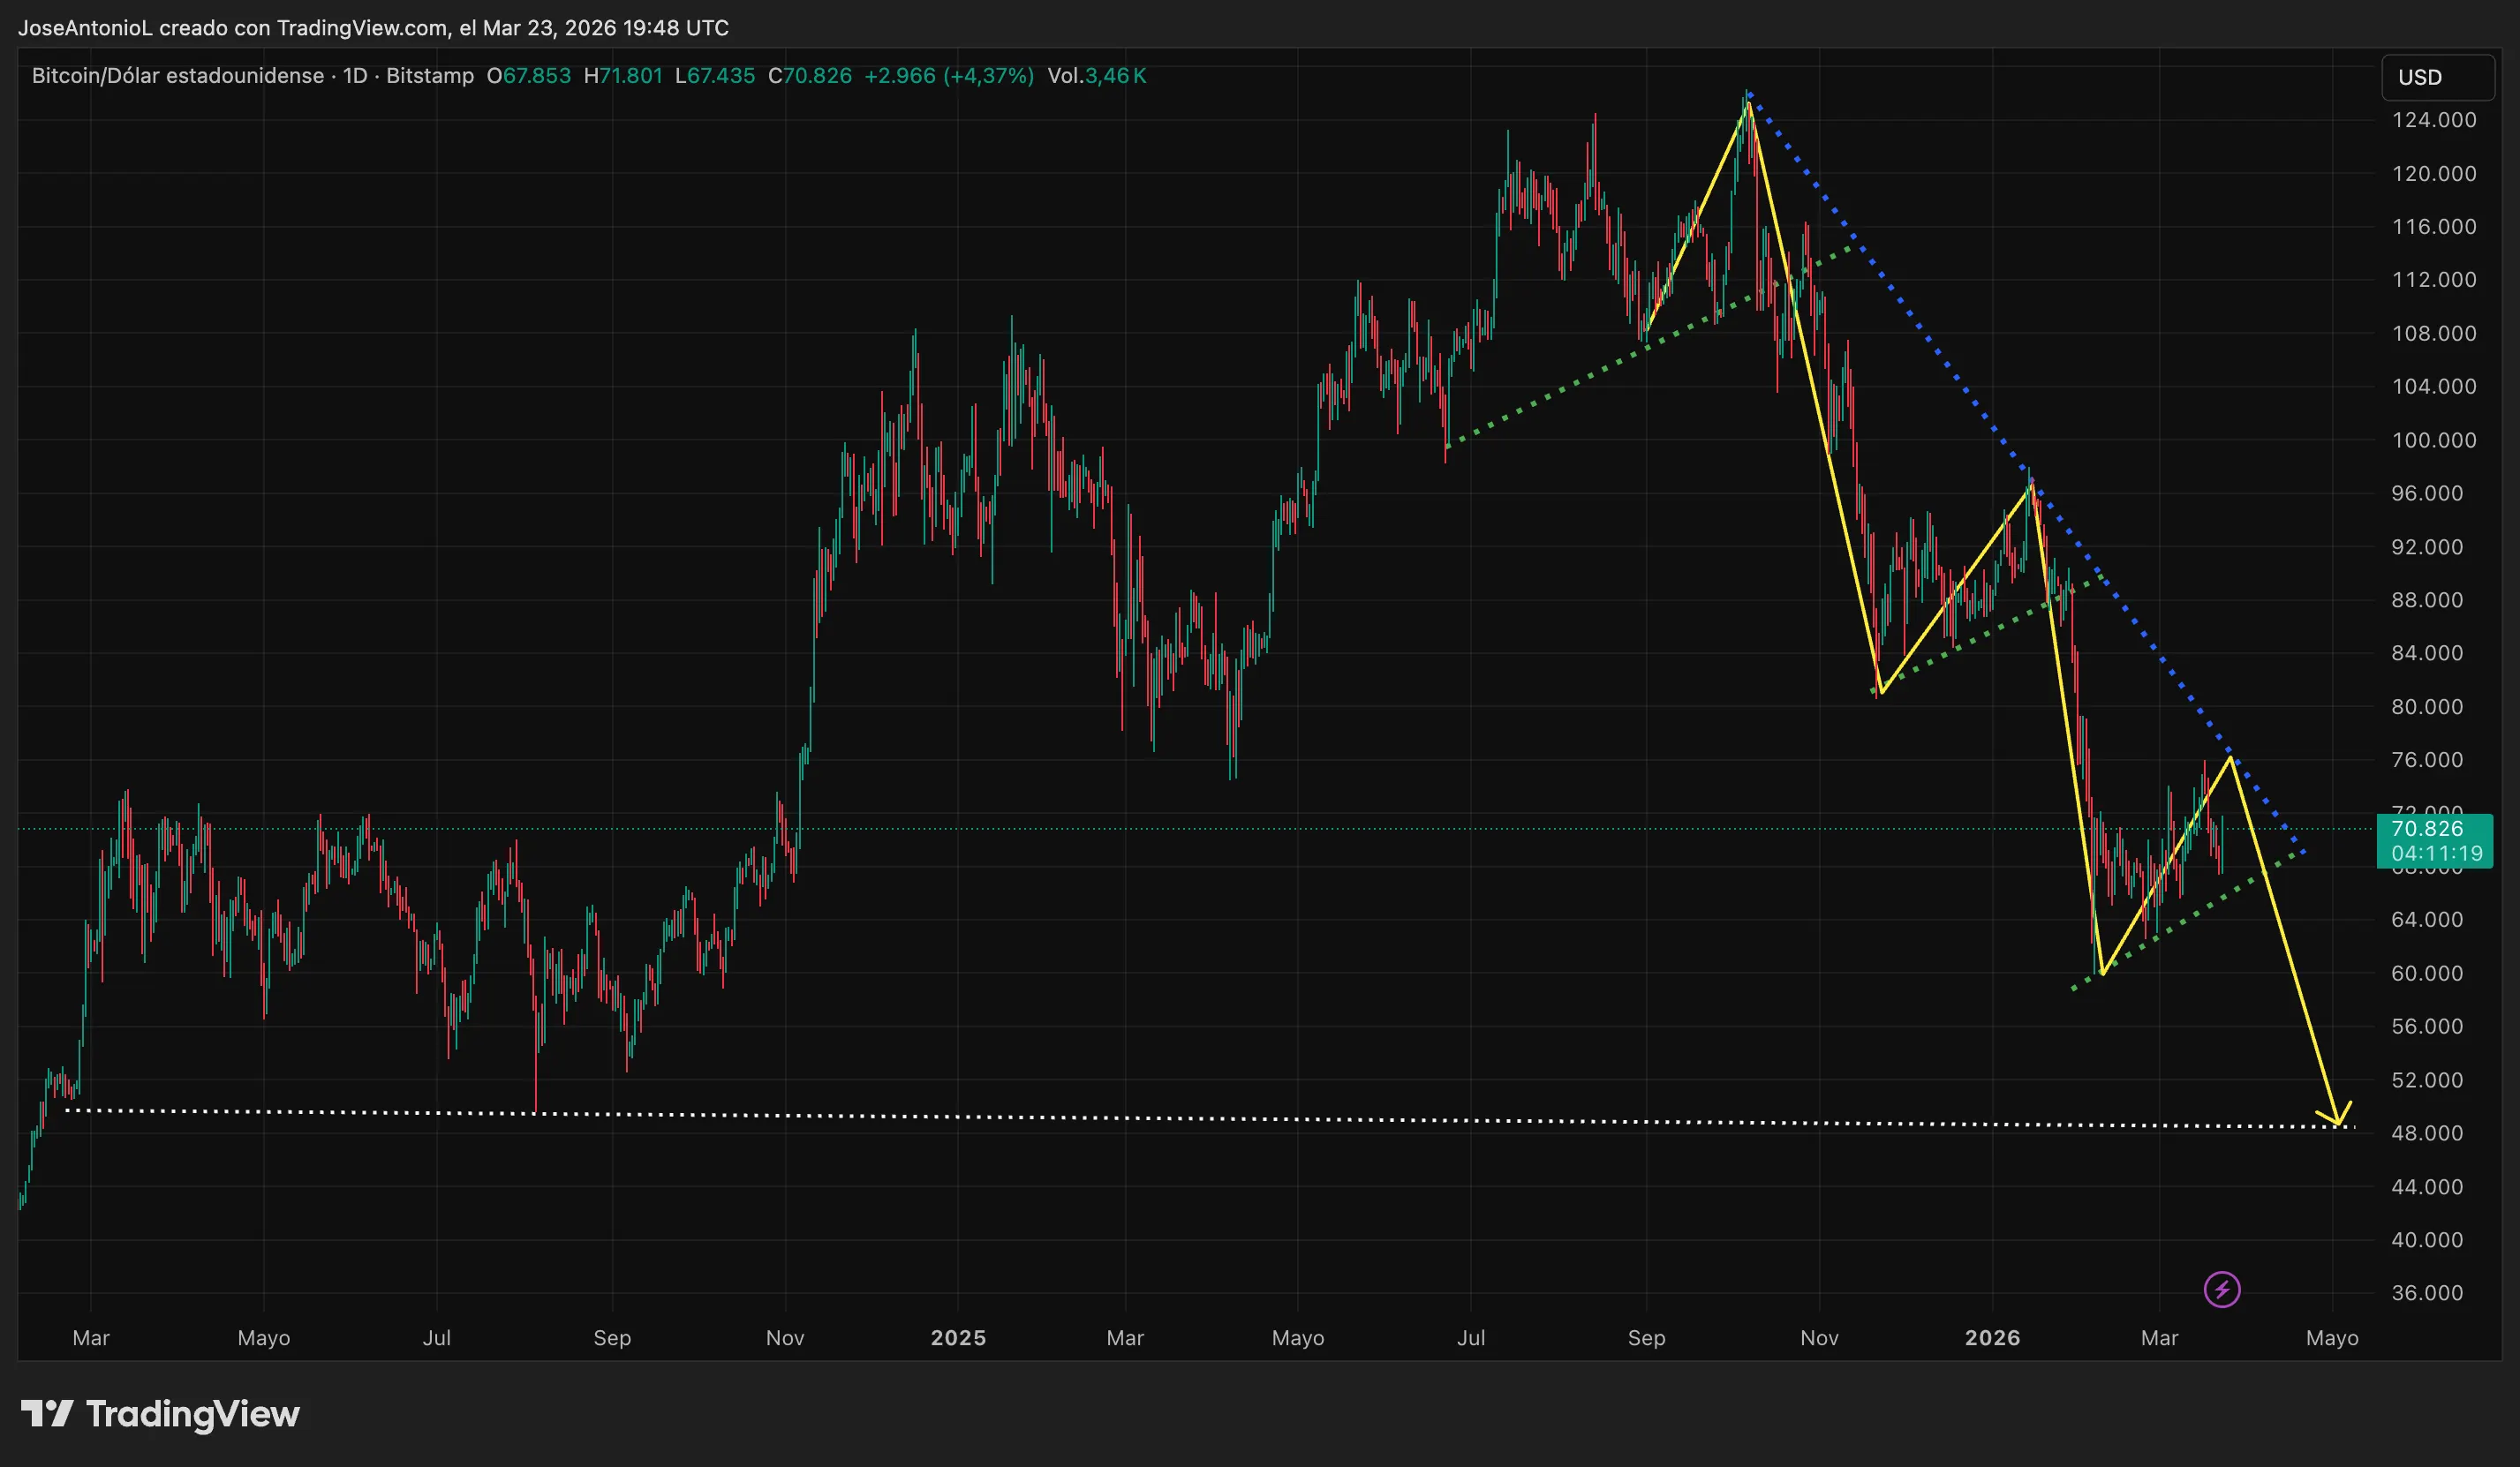
It happened after the October 2025 crash. Bitcoin recovered into that same wedge structure, touched resistance, and then broke down hard one month later.
It happened again after the January 2026 crash. Same wedge, same compression. Then the February 2026 wipeout to $59,000.
And right now Bitcoin is forming the exact same structure. The ascending support line is acting as the floor once more. The descending blue line is sitting just overhead, roughly around $70,000 depending on when it arrives. If the pattern holds, a third rejection somewhere in April or May 2026 would be on the table.
On Myriad, a prediction market built by Decrypt’s parent company Dastan, the question on everyone’s mind is framed plainly: “BTC next move: Pump to $84K or Dump to $55K?”
Right now, traders are placing 51.4% odds on the bullish outcome. But that’s not a ringing endorsement of Bitcoin’s health—it’s a toss up, and likely a reflection of how extreme the $55K scenario feels.
Most traders probably can’t stomach betting on a number that low, not because they’re convinced BTC is going up, but because the downside seems too painful to price in. The gap between bulls and bears is tight and follows the market sentiment.
The one thing that could change the story
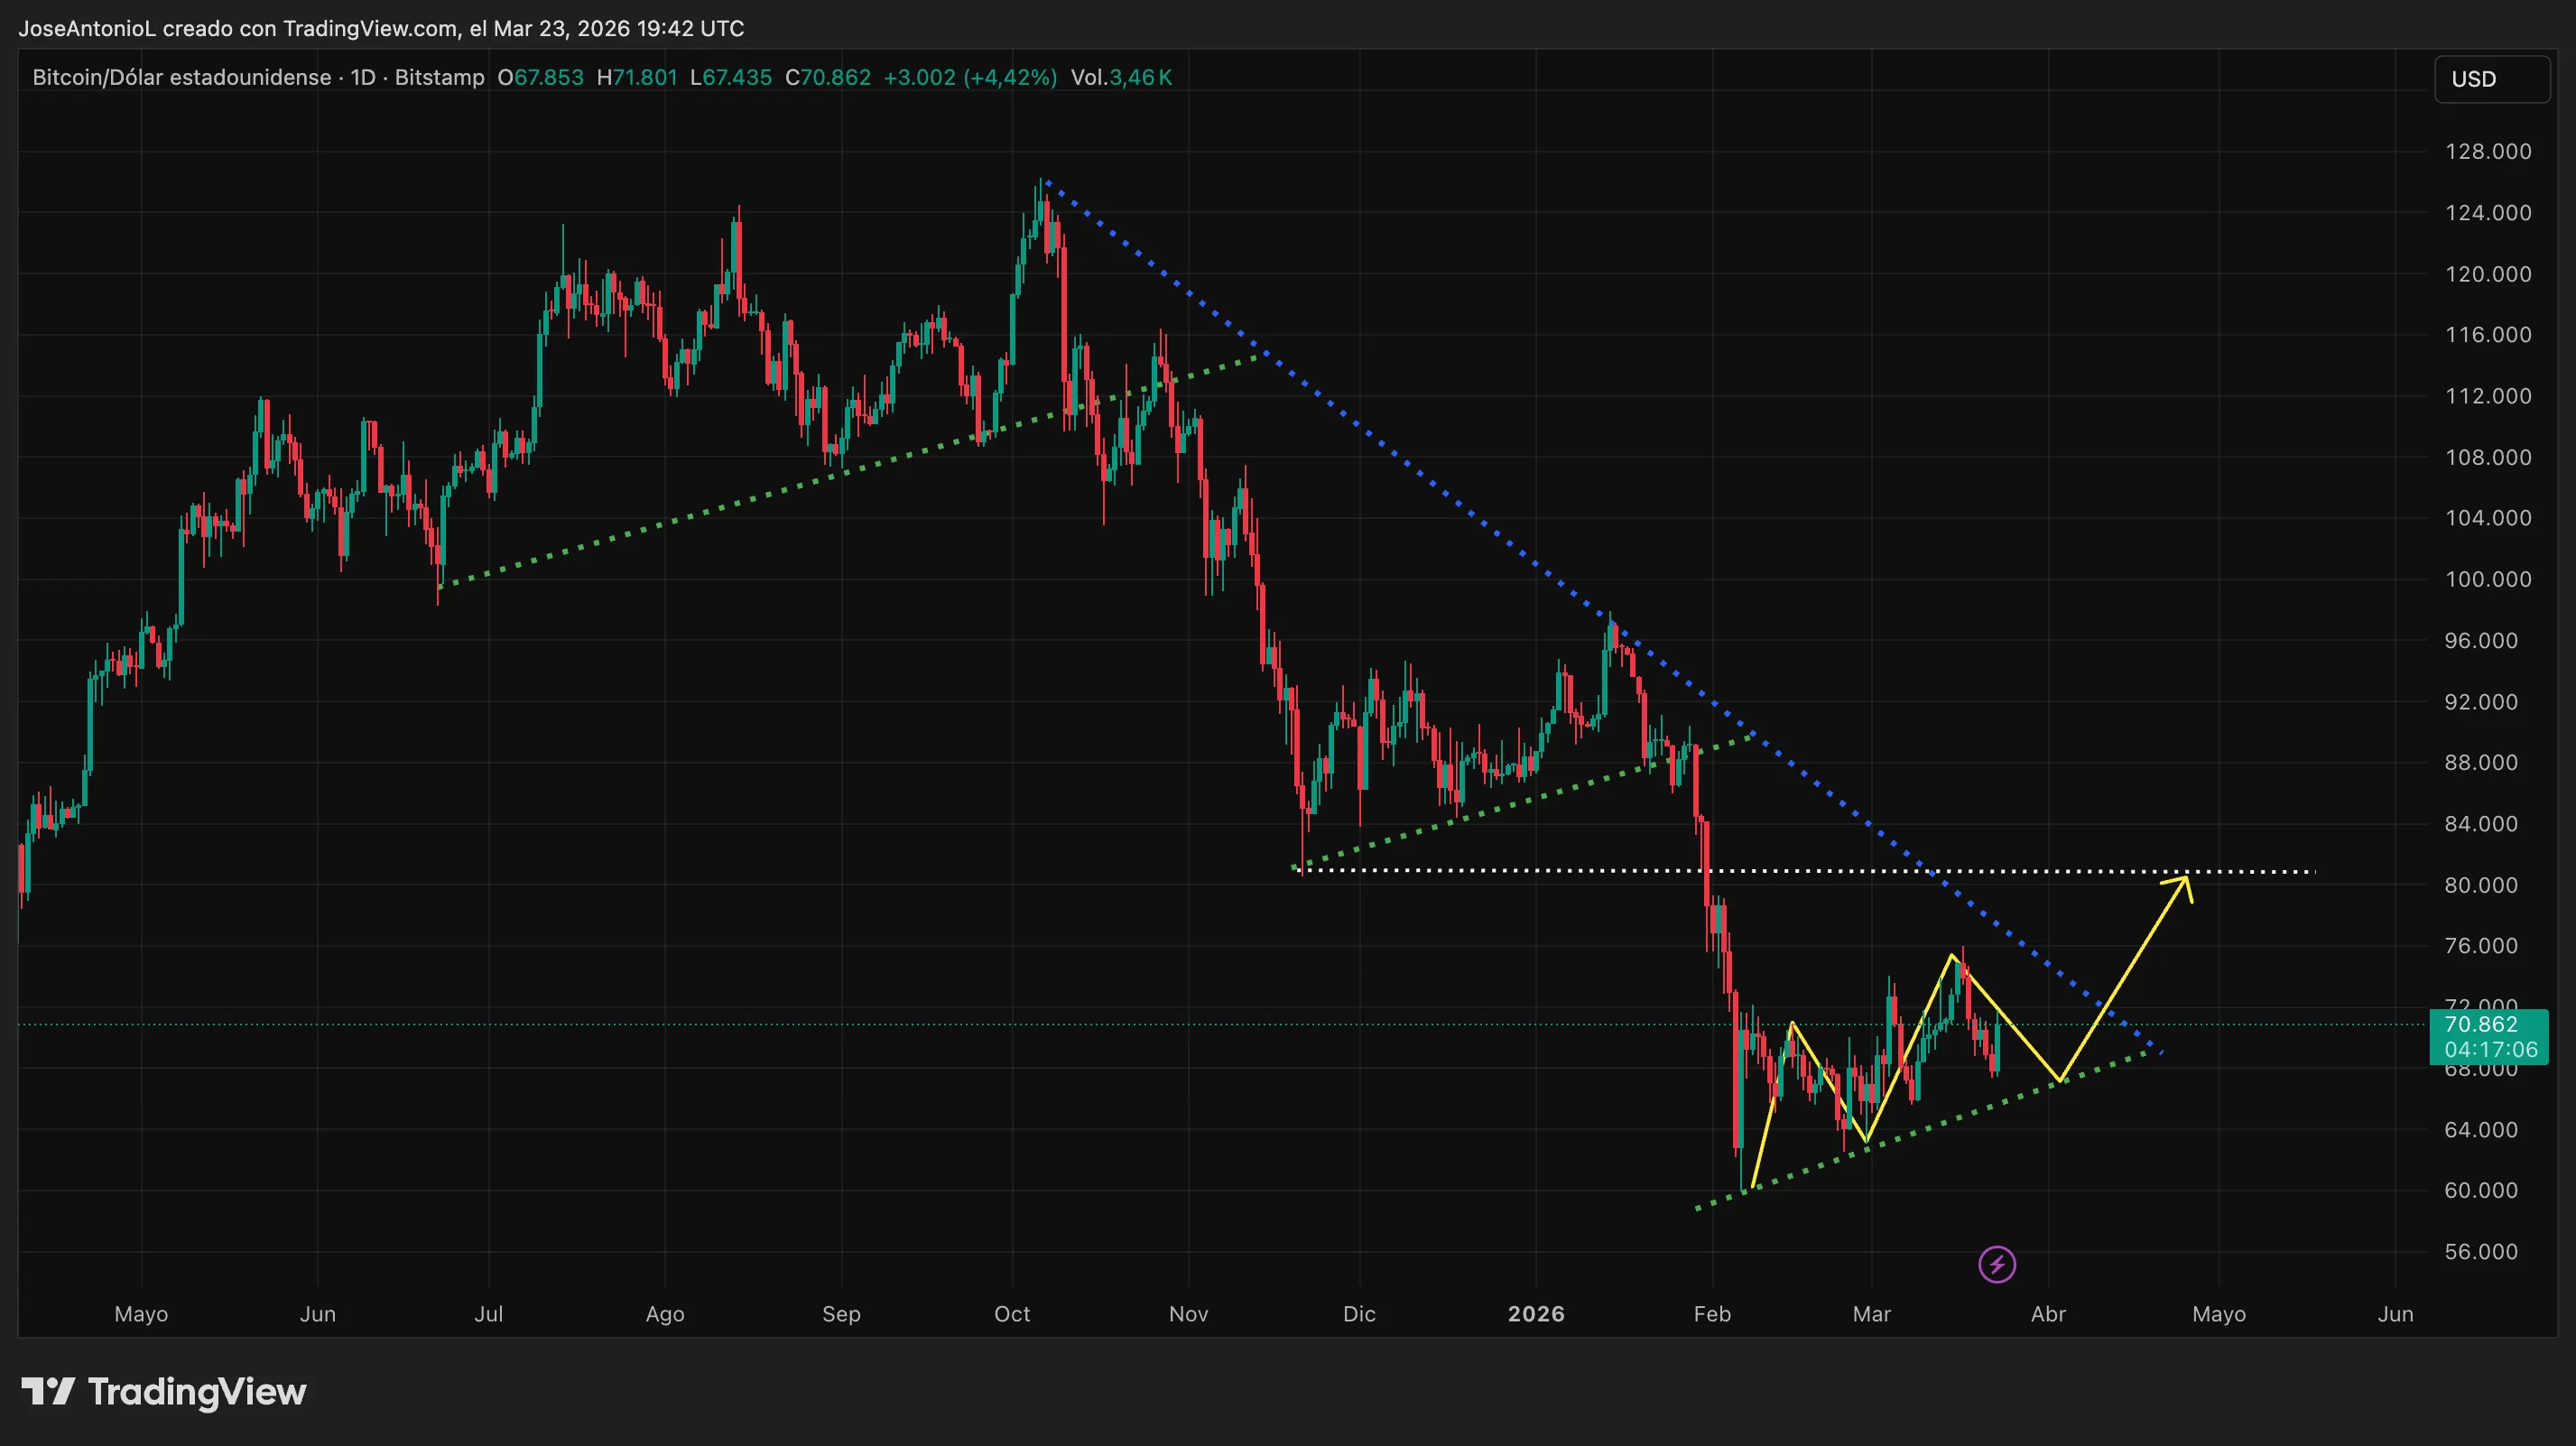
There is a scenario, though, where everything flips. If Bitcoin can break through that descending blue resistance with a strong, high-volume candle—not just touch it, but close decisively above it—followed by a series of candlesticks closing on top of the broken resistance, that would be a real signal. It would suggest the pattern has finally been broken, and that the market may have actually found a bottom around the $59,000–$64,000 range from early March.
If it respects its current support, the $80K zone becomes the next technical milestone to conquer.
That would be the kind of move that forces even skeptics to reconsider. Resistance lines that get convincingly broken tend to flip into support. (That’s just how these market dynamics work.)
But right now? The pattern is intact. Bitcoin may look nice in the short term. The immediate indicators look neutral instead of heavily bearish, the daily candle is green, and the shorts are hurting a little. None of that is reason to ignore what three data points of the same setup are telling us.
For bulls, the champagne will likely have to wait.
Disclaimer
The views and opinions expressed by the author are for informational purposes only and do not constitute financial, investment, or other advice.
Daily Debrief Newsletter
Start every day with the top news stories right now, plus original features, a podcast, videos and more.