
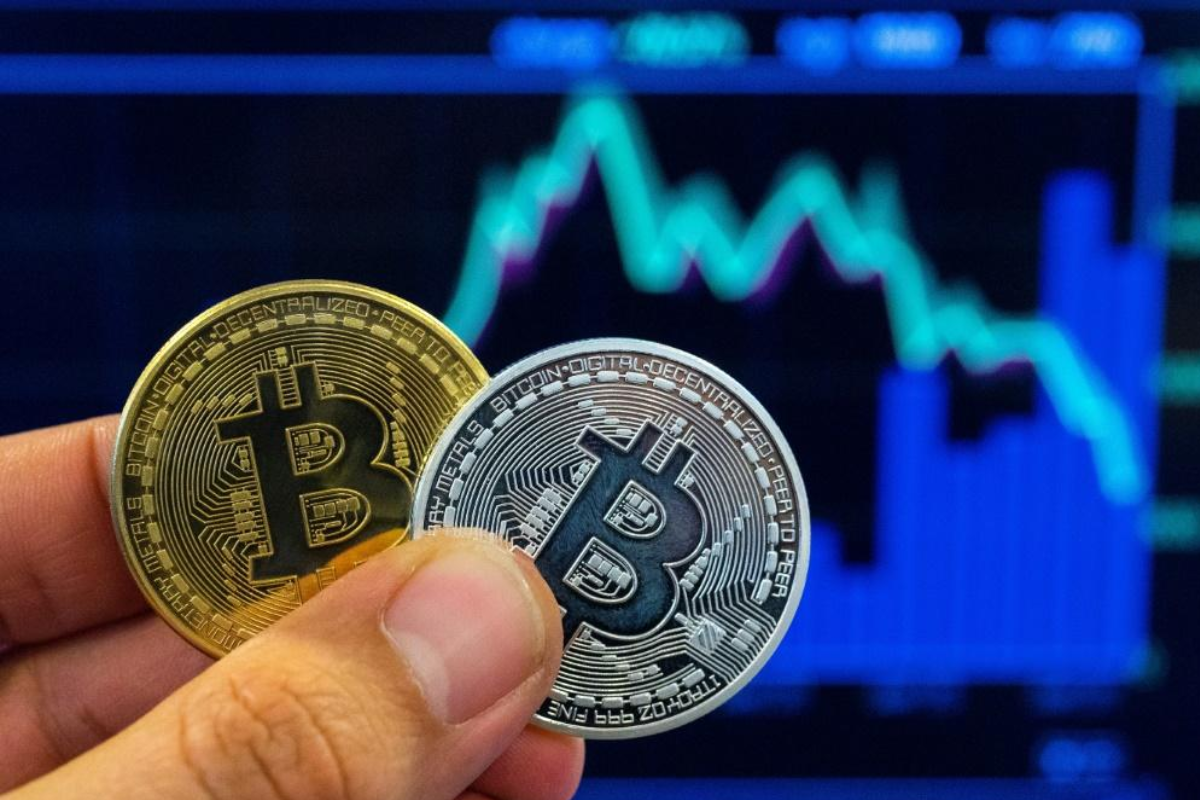
Bitcoin price hovered around $64,436 on Monday, 29 July, leaving traders in a stand-off as technical indicators pointed to a sharp move ahead but gave no clear direction.
The world’s largest cryptocurrency was pinned just below its 7-day and 20-day simple moving averages, and analysts said the market now looks trapped between well-defined support and resistance levels.
In early January 2026, Bitcoin traded close to $89,772, with bullish forecasts from high-profile commentators such as Tom Lee suggesting the rally had further to run.
Instead, the market has since given back nearly 28% from those highs. That retreat has created heavy ‘overhead supply’ from buyers who entered near the top and are now waiting for any bounce to cut their exposure, a dynamic that continues to weigh on price.
At the moment, the Bitcoin price is behaving like a market in limbo. The short-term trend has shifted from clearly bearish to flat, with BTC now sitting millimetres below its 7-day simple moving average at $64,445 and the 20-day at $64,513.
The moving average convergence divergence (MACD) histogram has flattened to zero, signalling neither bullish nor bearish momentum. In practical terms, that means the next move is more likely to be explosive than gentle, but anyone claiming to know the direction is guessing.
The relative strength index, at 50.79, tells a similar story. This is not a comfort zone so much as a midpoint that can quickly tilt either way.
The market is also thinning out. Spot volume on Binance over 24 hours barely cleared $900 million, while the intraday range of roughly $1,729 looks tight for an asset whose average true range is near $1,465. The price is moving, but not by much, and not with conviction.
Key Bitcoin Price Levels Traders Are Watching
The near-term chart structure for Bitcoin is unusually clean. On the upside, immediate resistance sits at $65,023. Analysts argue that this is not a level to be treated as a casual scalp.
A convincing break above it, backed by growing volume, would open the path to the next test at $65,611, before the upper Bollinger band comes into play at $66,340. Both resistance zones sit inside a congestion area that has repeatedly capped rallies during the long grind down from the $89,000 region.
The downside map is just as stark. The pivot at $63,883 is described by market watchers as a line of demarcation rather than a mere warning sign. A daily close below that level would likely embolden short sellers. Below it, there is thin support at $63,295, and then the ‘trapdoor’ at $62,154, close to the lower Bollinger band at $62,685. If that area fails, the narrative would shift decisively away from any notion of a basing pattern.
There is one structural detail that still gives Bitcoin bulls something to point to. Price has so far held above the 50-day simple moving average at $63,398. Until that is broken on a closing basis, technicians can argue that BTC might be building a base rather than staging a classic dead-cat bounce.
The 200-day moving average at $71,772, by contrast, looks remote. Any suggestion that it is ‘in play’ this week is not grounded in the current chart.
Sentiment, Crowded Longs and the Next Bitcoin Price Shock
Positioning tells its own, slightly uncomfortable story. Both retail traders and so-called smart money are leaning long. The global long/short ratio stands at 1.64, with top trader positioning almost identical at 1.65. That works out to roughly 62% of the derivatives market betting on higher prices. On the surface, that sounds like confidence.
In reality, it is a vulnerability. Crowded trades are fragile, and if Bitcoin cannot reclaim $65,023 in the next session or so, those leveraged longs could quickly become fuel for an accelerated move lower.
Other indicators underline just how finely balanced the market is. The taker buy/sell ratio is at 1.0084, essentially neutral, suggesting there is no real aggression from buyers in spot markets.
Open interest has risen 1.99% in the past 24 hours, meaning fresh capital is coming into derivatives, but without any corresponding breakout in price. That is exactly the kind of backdrop in which a sharp ‘stop hunt’ below $63,883 would inflict maximum damage on overextended longs.
Funding rates at 0.01% remain muted, implying that the derivatives market is not yet in a frothy long-squeeze setup. Still, that measure can change quickly if price jolts in either direction.

Photo: Pixabay
On the fundamental side, there is a notable silence. The most prominent bullish calls are now more than six months old. Tom Lee’s prediction that Bitcoin would keep climbing from its January highs near $89,772 has, so far, been rejected by the market. Since then, there has been no new wave of high-conviction forecasts from major analysts.
That absence is itself a signal. When price sits around $64,000 and the Bitcoin price outlook is this uncertain, seasoned voices often prefer to stay quiet rather than risk calling it wrong in public.
This is being treated as a binary range-resolution setup. One widely cited bull strategy is to wait for a firm hourly close above $65,023, then look for a retest of that level as support in the $64,800 to $65,050 area. Under that plan, partial profits are taken around $65,611, with a stretch target near $66,340 and a hard stop at $63,883.
The bearish approach, by contrast, focuses on a failure to reclaim the 20-day moving average at $64,513 on any intraday bounce, followed by a daily close below $63,883. Short entries around $63,800 to $63,900 than target $62,154, with a stop at $65,100. Both structures aim for a risk/reward skew of roughly two to one or better.
One internal probability model cited by Blockchain news puts the base case at a 55% chance that the Bitcoin price continues to grind between roughly $63,400 and $65,000 for another day or two before breaking out, a 30% chance of a push higher towards $65,611, and a 15% chance of an immediate flush to $62,154.
Nothing is confirmed yet, and those figures should be treated with caution rather than certainty, but they capture the core dilemma: too many traders are on the same side of the boat, and the water is getting choppy.