

Bitcoin (BTC) is trading below its long-term valuation average, while US tech stocks continue to hover near record premium levels, according to asset management firm Bitwise. The firm said Bitcoin’s market-value-to-realized-value (MVRV) ratio currently stands at 1.42, which is only 36% below its historical average.
Nearly 99% of historical Nasdaq-100 price-to-book readings were below current levels, marking one of the widest valuation gaps between BTC and US tech on record.
Bitcoin price trails US stock valuations
In its weekly Crypto Market Compass report, Bitwise said Bitcoin’s MVRV ratio currently sits in the lower half of its historical range. The MVRV compares Bitcoin’s market capitalization to the value of its coins based on their most recent onchain activity, making it similar to a price-to-book ratio used in equities.
Only 36% of Bitcoin’s historical MVRV readings were lower than today’s level. In contrast, nearly 99% of historical Nasdaq-100 price-to-book ratios were below their current levels. Bitwise described the spread as the widest valuation gap on record between Bitcoin and US tech stocks.
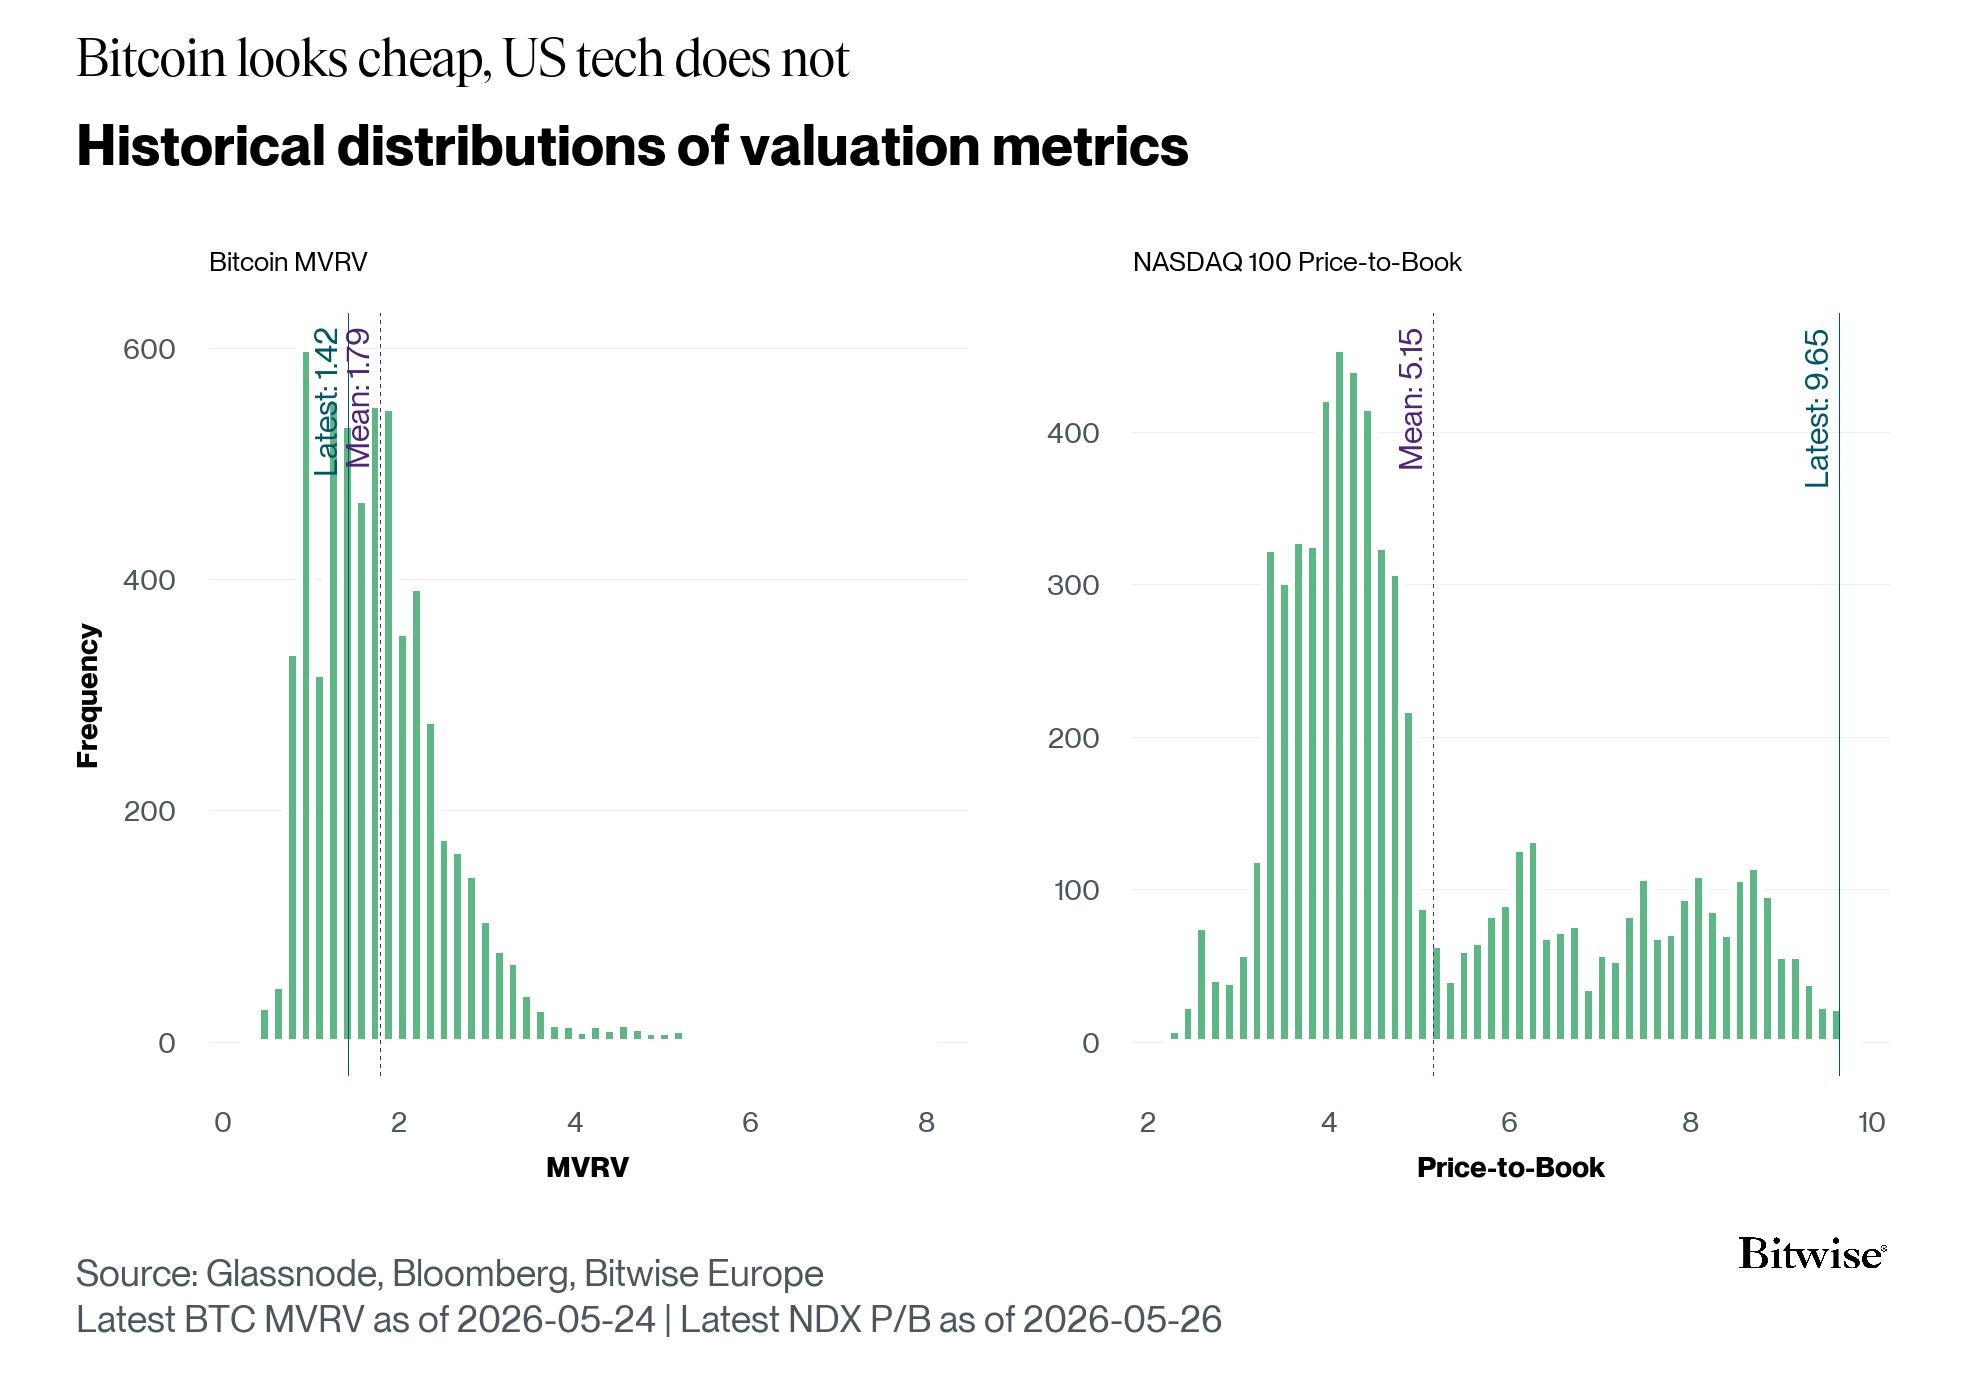
Bitcoin and NASDAQ 100 valuation metrics analysis. Source: Bitwise
Bitwise said the divergence may partly stem from capital crowding into US mega-cap tech stocks, especially AI-linked companies that investors increasingly treat as alternative hard assets alongside gold. Bitwise added:
“The rallies in both US equities and gold may also be a harbinger of rising appetite for hard assets more broadly, which may provide a tailwind for Bitcoin down the road.”
Crypto research firm XWIN Japan pointed to the same concentration trend in US equities. The firm said hedge fund leverage has climbed near 293%, while dollar-based short positions in the S&P 500 reached record levels. Nvidia alone accounted for roughly $62.5 billion in short exposure, ahead of Apple at $38.5 billion and Microsoft at $33.7 billion last week.
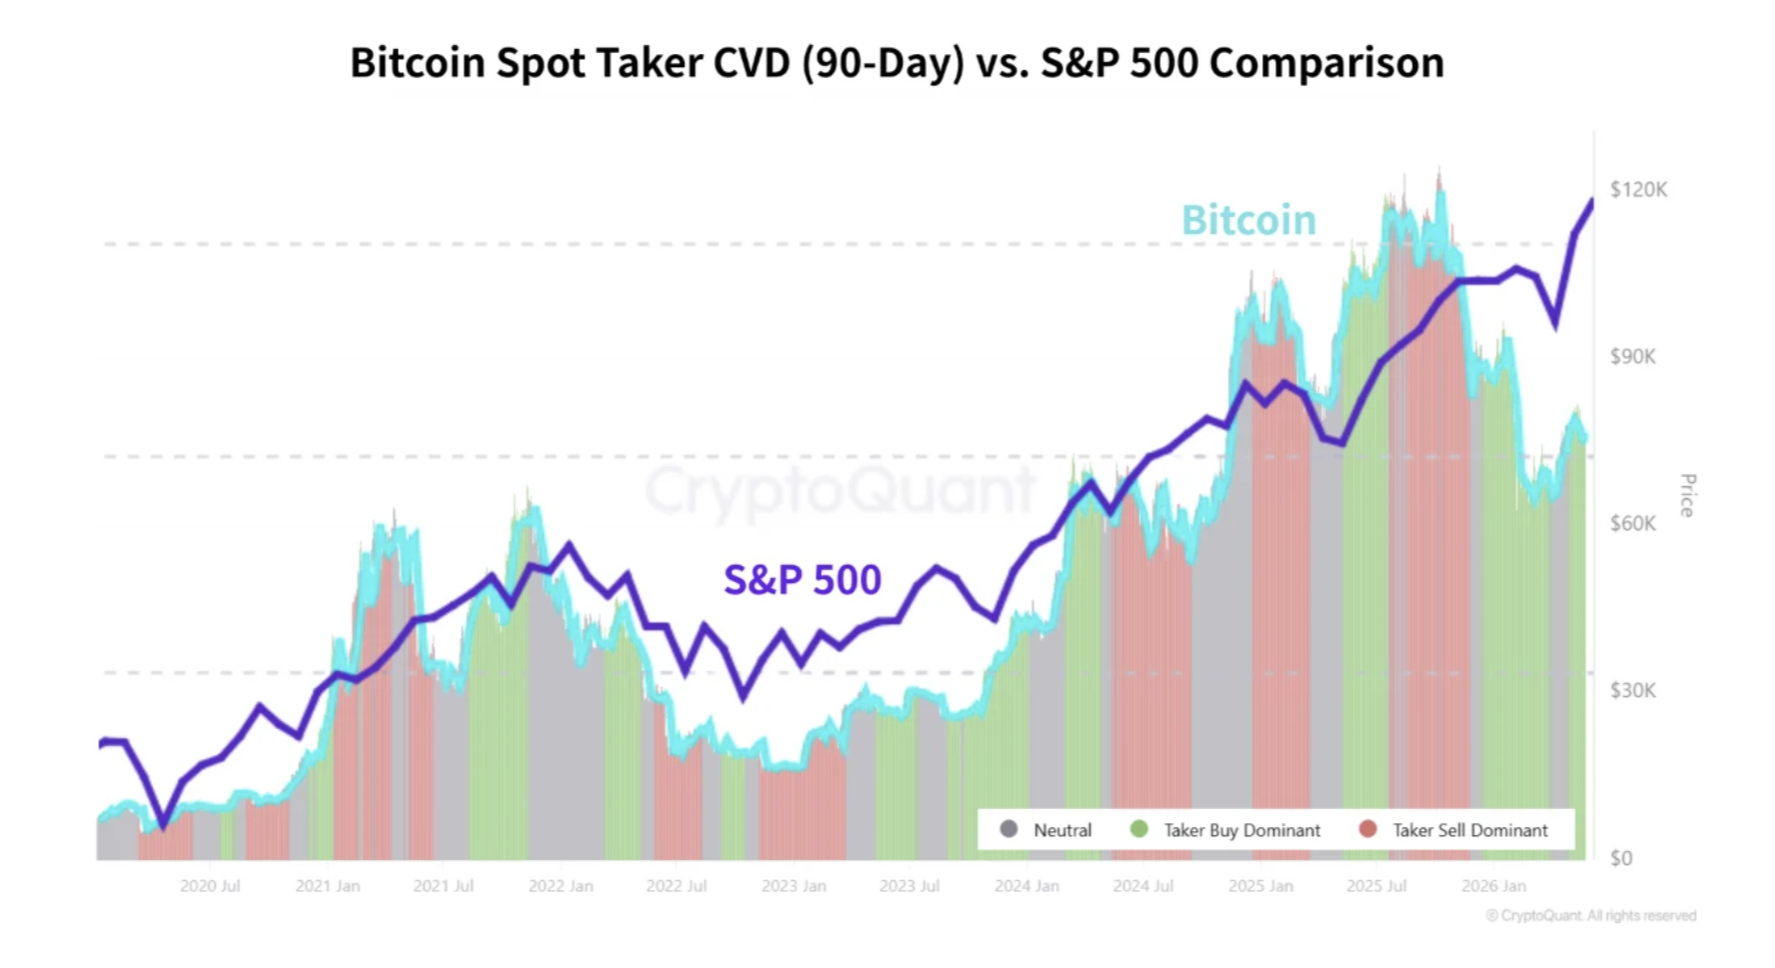
Bitcoin spot taker CVD vs S&P 500 Comparison. Source: CryptoQuant
XWIN Japan said the concentration in equities also carries implications for Bitcoin. BTC sold off alongside equities during the March 2020 COVID crash, and Bitcoin broadly moved in the same direction as the S&P 500 between 2020 and 2022.
That relationship has weakened since 2025. The S&P 500 has traded in a relatively stable range while Bitcoin has recorded larger price swings. XWIN Japan linked the move to strong spot buying activity and continued spot exchange-traded fund (ETF) flows, which are increasingly shaping BTC price action through crypto-specific demand. XWIN added:
“This indicates Bitcoin may be evolving from a pure ‘risk asset’ into a hybrid asset class — still sensitive to macro liquidity, but increasingly capable of following its own market structure.”
Related: Bitcoin chases range highs despite rising BTC exchange inflows: Is $80K next?
Bitcoin index hints at “low-risk” setup: Analyst
Crypto analyst MorenoDV said the BTC Risk Index recently climbed back above 2, a level that previously appeared near major market lows. The index tracks the flow of capital through the Bitcoin market relative to Bitcoin’s total market value.
Higher readings usually appear during panic-driven sell-offs, when BTC changes hands rapidly, while lower readings often appear near overheated market tops, where buying activity slows.
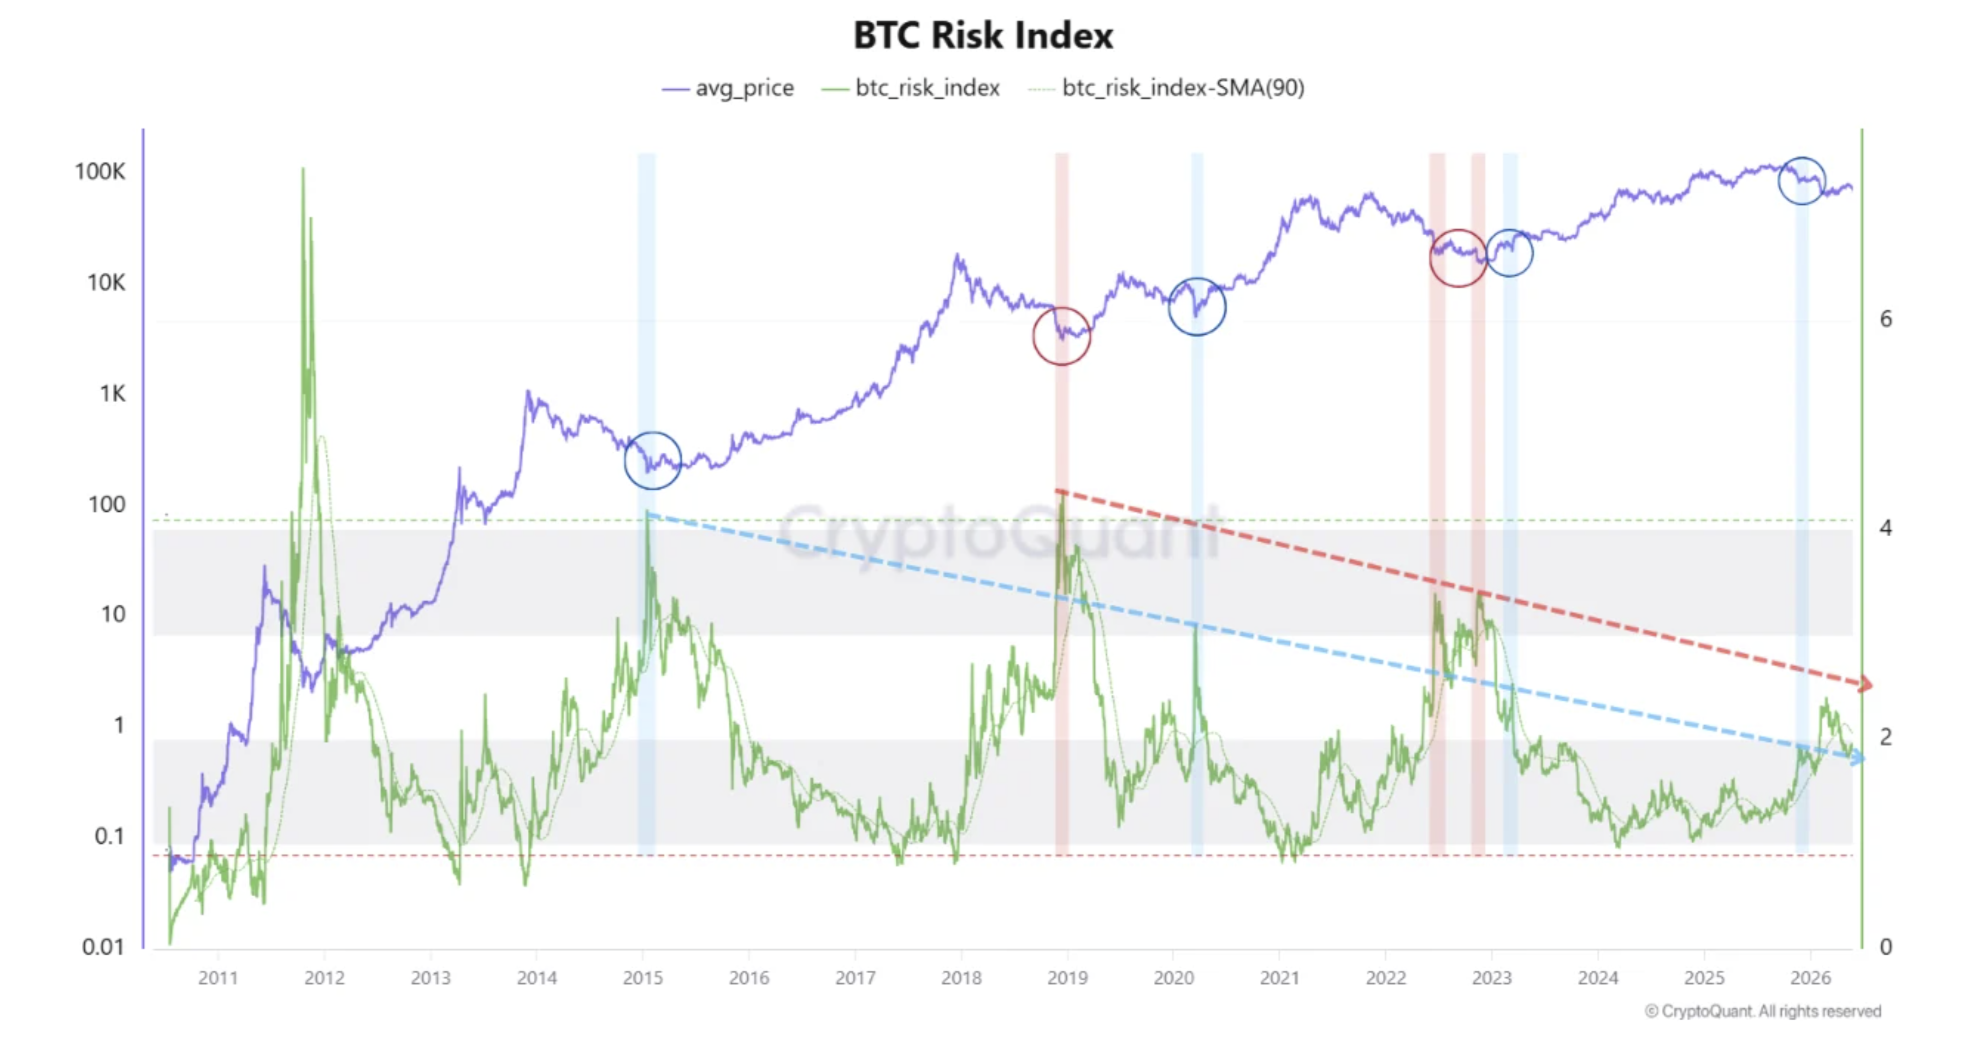
BTC risk index. Source: CryptoQuant
The chart highlights similar spikes during the 2015 post-Mt. Gox collapse, the 2018 bear market bottom, the March 2020 COVID crash and the 2022 Terra Luna and FTX exchange implosion. Current readings mark the strongest signal since early 2023, though each cycle peak has become smaller over time as Bitcoin’s market size expanded.
MorenoDV said the pattern points to less extreme market resets compared with earlier cycles. The latest reading places BTC in a lower-risk range relative to earlier cycles, though it does not reflect the stress levels seen during capitulation events in 2020 or 2022.
Related: Bitcoin’s big cup-and-handle pattern targets ‘minimum’ $220K BTC price