

As the market trades around $3,911, it stands at the intersection of multiple converging technical and cyclical forces. The recent recovery above the VC PMI daily pivot of $3,890 and the weekly pivot of $3,873 has reestablished a bullish mean reversion structure, confirming that the market has shifted from the reactive phase into a continuation mode.
The breakout from the mid-week consolidation band has now aligned with the 30-day cycle upswing emerging from the 360-day anchor low of September 28, 2024, which historically marks a pivotal timing window for long-term trend reversals in the precious metals complex.
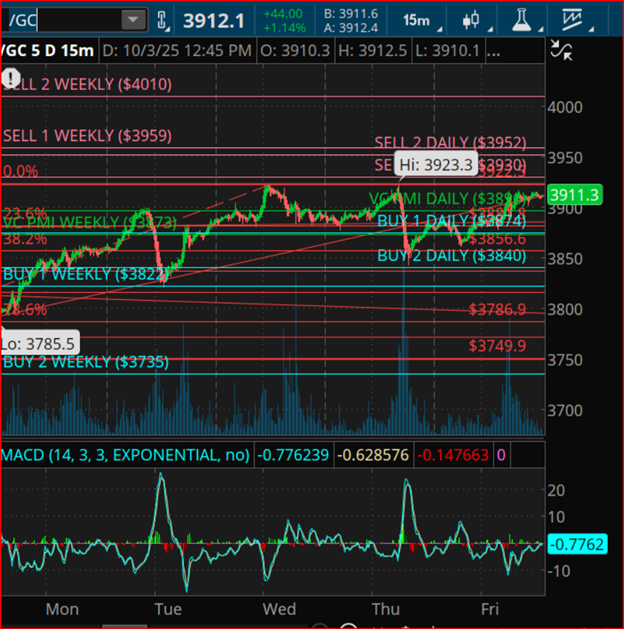
In cycle terms, the 360-day anniversary window (September 25–October 2) has acted as the launch point for renewed bullish energy, consistent with a new yearly rhythm. Each subsequent 30-day interval—projected for October 27–30, November 26–December 1, and December 26–30—represents potential turn dates or acceleration points within this broader uptrend.
Historically, such windows coincide with profit-taking waves or renewed momentum thrusts as the market rebalances time and price geometry. The current trajectory suggests that gold could extend its rally into the first window at month’s end before encountering its next resistance phase.
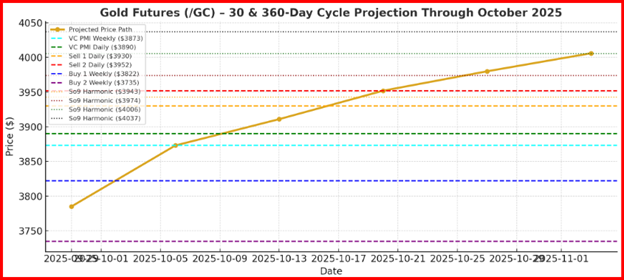
The expanded line chart above for Gold Futures (/GC) projecting price action through the end of October 2025 under the 30- and 360-day cycle structure:
- The gold line shows the projected continuation of the current uptrend from $3,785 → $4,006, consistent with the mean reversion acceleration phase.
- The dashed lines display VC PMI levels, confirming equilibrium and control zones.
- The dotted lines represent Square-of-Nine harmonics (3,943, 3,974, 4,006, 4,037) — key price resonances aligned with the late-October 30-day time window.
This projection reflects an anticipated bullish extension toward $4,000–$4,037 as long as prices remain above $3,873–$3,890.
From a Square-of-Nine (So9) perspective, the dominant harmonic cluster between $3,943–$3,974 coincides perfectly with the Sell 1 and Sell 2 daily levels ($3,930–$3,952) and the Sell 1 weekly level ($3,959). This tight confluence defines a powerful resistance corridor where price is likely to pause or revert temporarily.
A confirmed close above $3,974 would open the gateway to the $4,006–$4,037 So9 range, representing the next full-turn harmonic and aligning with the Sell 2 weekly target at $4,010. On the downside, harmonics at $3,880–$3,849 align with Buy 1 and Buy 2 daily supports, reinforcing that area as a key defensive demand zone.
Momentum indicators further support the bullish thesis. The MACD, though stabilizing near zero, hints at an underlying coiled energy pattern. Should volume expand and MACD confirm a positive crossover above the zero line, it would validate a continuation toward the upper So9 harmonics near $4,000 into the late-October 30-day window.
In essence, gold has emerged from a major time cycle reset and is entering a phase of mean reversion acceleration within a new 360-day expansion cycle. The equilibrium now rests above $3,890; maintaining closes above this level preserves the upward bias toward $3,943–$3,974–$4,010. As time and price harmonize, the October and November windows will determine whether this movement evolves into a full 360-day upcycle targeting $4,150–$4,200 by early 2026.
***
TRADING DERIVATIVES, FINANCIAL INSTRUMENTS AND PRECIOUS METALS INVOLVES SIGNIFICANT RISK OF LOSS AND IS NOT SUITABLE FOR EVERYONE. PAST PERFORMANCE IS NOT NECESSARILY INDICATIVE OF FUTURE RESULTS.