Close Menu
Invest Insider News
    Facebook X (Twitter) Instagram
    Friday, March 13
    Facebook X (Twitter) Instagram Pinterest Vimeo
    Invest Insider News
    • Home
    • Bitcoin
    • Commodities
    • Finance
    • Investing
    • Property
    • Stock Market
    • Utilities
    Invest Insider News
    Home»Bitcoin»Bitcoin Realized Cap Sets New Record, Market Cap Next?
    Bitcoin

    Bitcoin Realized Cap Sets New Record, Market Cap Next?

    October 26, 20243 Mins Read


    On-chain data shows the Bitcoin Realized Cap has set a new all-time high (ATH) recently as the market has witnessed sharp capital inflows.

    Bitcoin Realized Cap Has Just Set A New Record

    According to data from the on-chain analytics firm Glassnode, the capital inflows into Bitcoin have accelerated recently based on the trend in the cryptocurrency’s Realized Cap.

    The “Realized Cap” here refers to an on-chain capitalization model for BTC that calculates the asset’s total value by assuming that the ‘real’ value of each coin in circulation is the price at which it was last transacted on the network. This previous transfer of any coin is likely to be the last point at which it changed hands, so the price at its time could be considered as its current cost basis. As such, the Realized Cap is a sum of the cost basis of all coins in circulation.

    One way to look at the model, therefore, is as a measure of the total amount of capital that the investors have put into the cryptocurrency. In contrast, the usual market cap, which calculates the total value of the BTC supply at the current spot price, represents the value that the holders are carrying right now.

    Now, here is the chart shared by Glassnode that shows the trend in the Bitcoin Realized Cap and its 30-day change over the past few years:

    Bitcoin Realized Cap

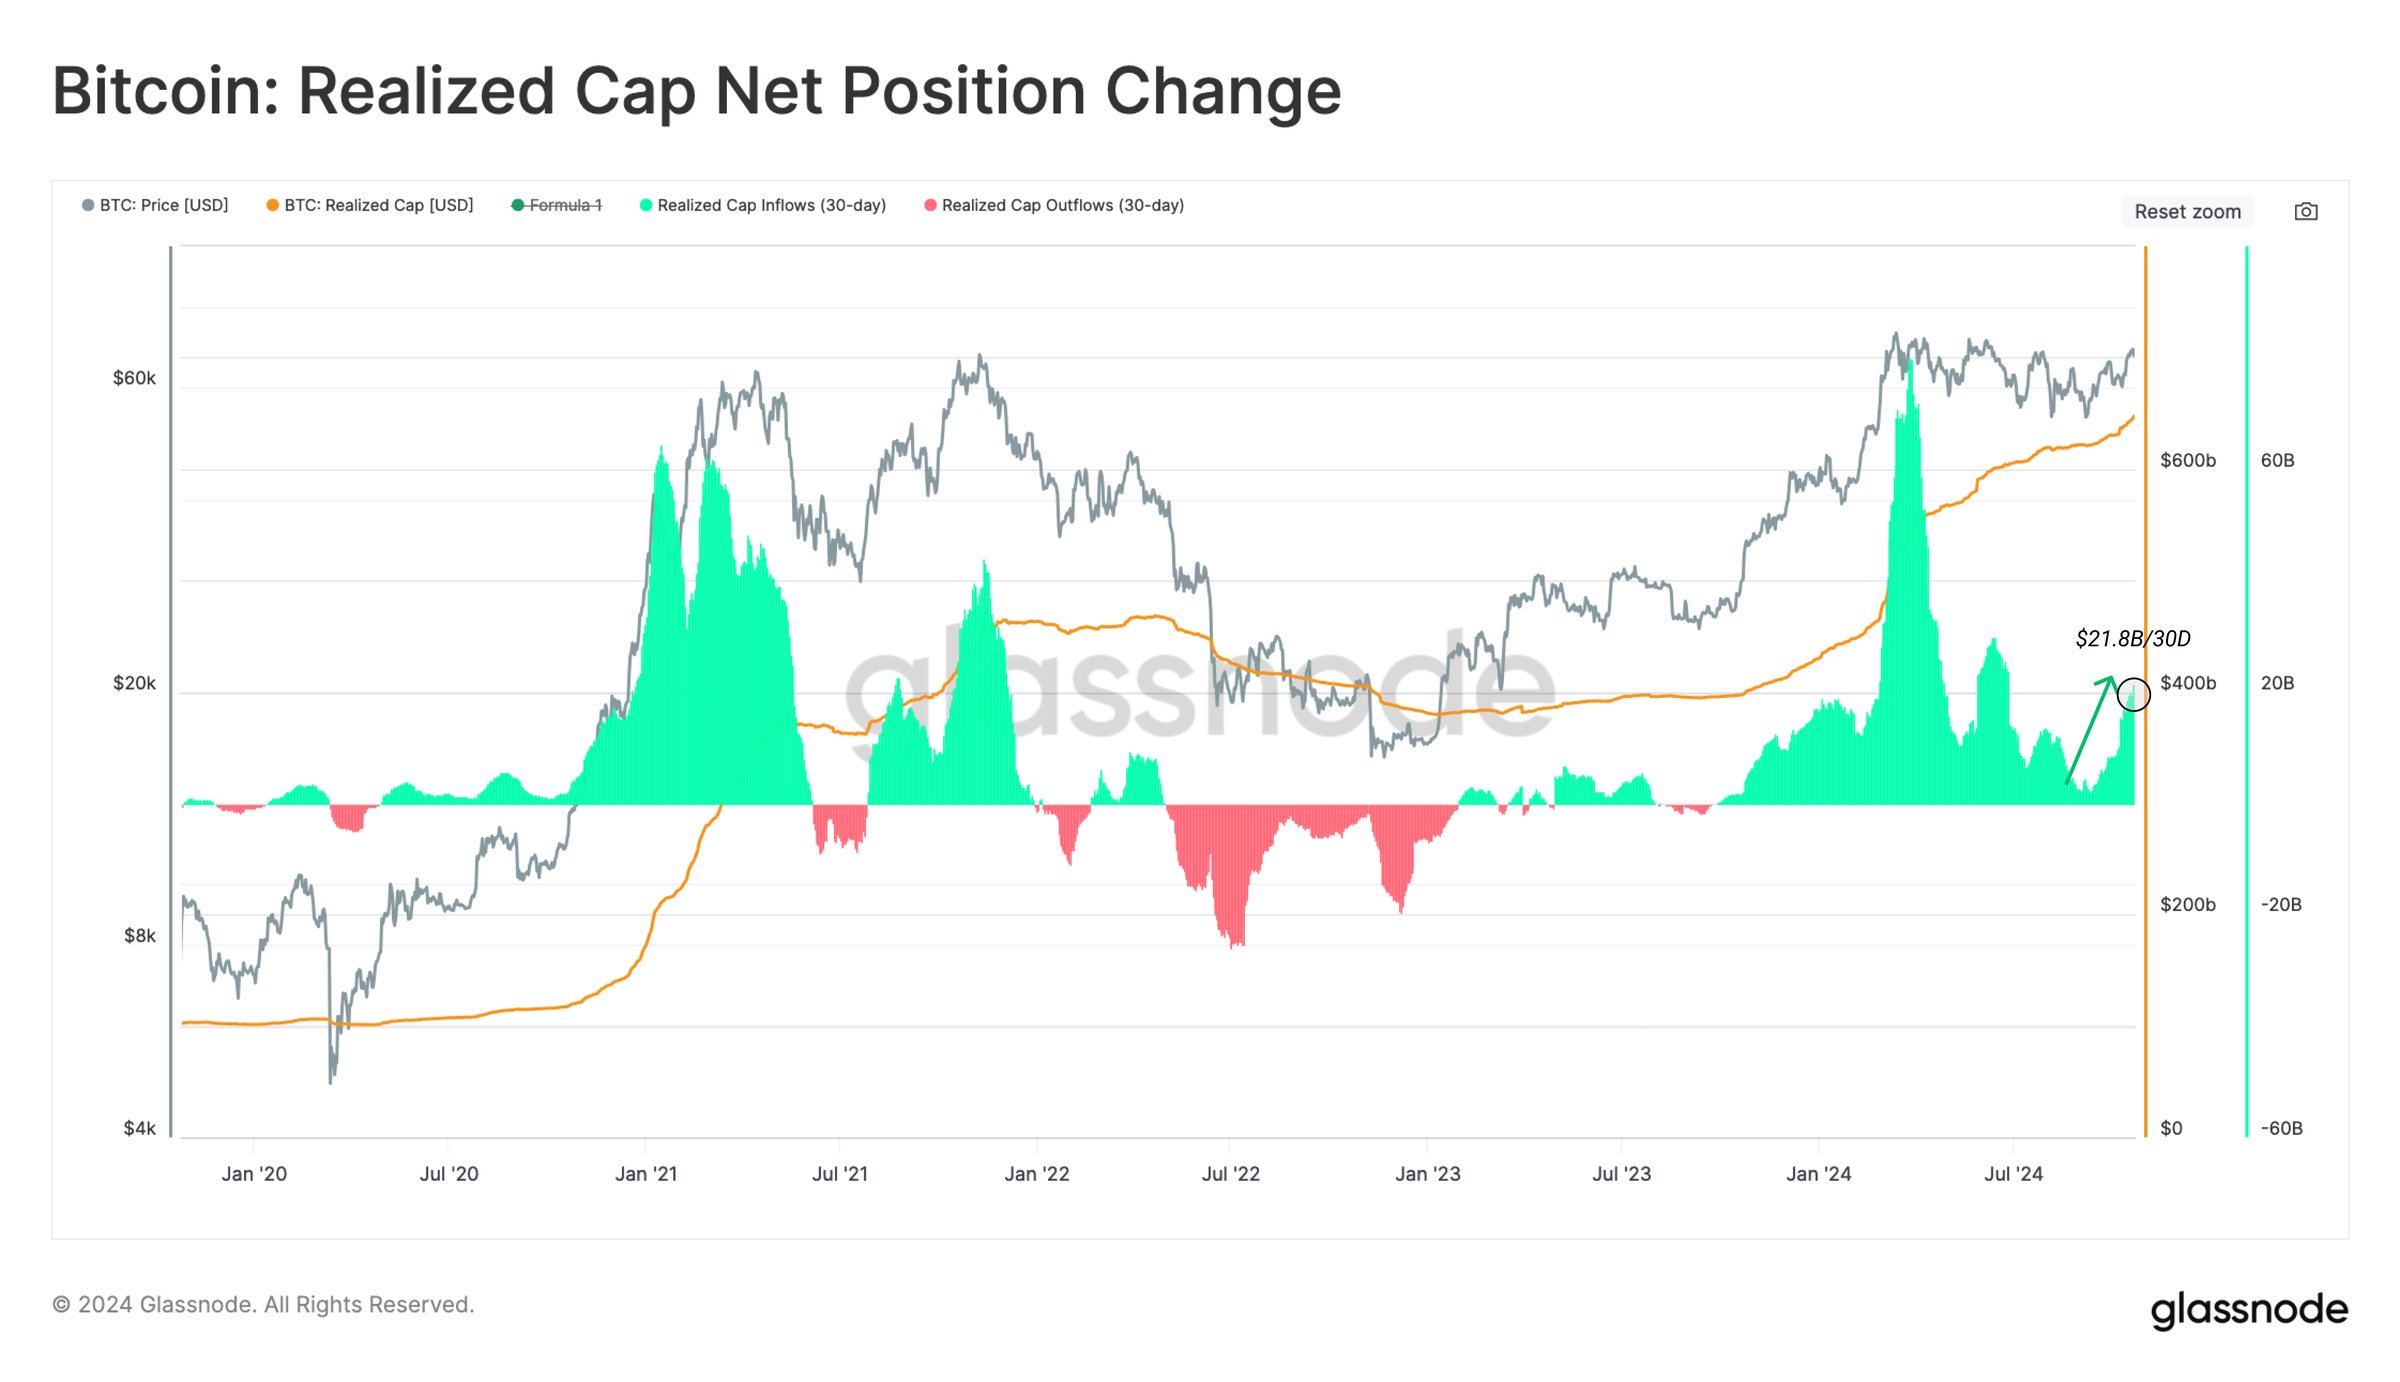
    The value of the metric appears to have been heading up in recent months | Source: Glassnode on X

    From the graph, it’s visible that the Bitcoin Realized Cap has been almost entirely observing positive growth since early 2023 as the metric’s 30-day net change has remained green.

    The indicator’s increase was slow for much of last year, but it started to ramp up once 2024 approached. And in the first quarter of this year, the metric set a new record as its 30-day change reached positive levels surpassing the 2021 bull run highs.

    As the Realized Cap represents the amount the investors as a whole have invested, the 30-day change in its value reflects the capital flows moving in or out of the asset. It’s apparent from the chart that BTC’s ATH earlier in the year coincided with the peak inflows into the coin.

    During the asset’s consolidation that followed the high, though, the demand became muted, with the Realized Cap witnessing a slowdown. The trend has finally shifted again recently, as the 30-day net change in the metric has once more surged.

    Over the past month, the indicator has grown by around $21.8 billion, which has taken it to a new record of over $646 billion. Glassnode has noted this suggests “liquidity across the asset class is rising, & meaningful capital inflows support the price increase.”

    BTC Price

    Despite the sharp capital inflows, the Bitcoin rally has hit a pause as the coin’s price is still trading around $68,000.

    Bitcoin Price Chart

    Looks like the price of the coin has been consolidating recently | Source: BTCUSDT on TradingView

    Featured image from Dall-E, Glassnode.com, chart from TradingView.com


    Source link

    Share. Facebook Twitter Pinterest LinkedIn Tumblr Email
    Previous ArticleShould You Invest or Buy a House?
    Next Article At an informal ‘minireunion’ with her General Electric finance division co-workers, Betty Puleri got to see her ‘family’ again | Central Berkshires

    Related Posts

    Bitcoin

    Why the XRP Price Can’t Break Out Until Bitcoin Clears $75,000

    March 12, 2026
    Bitcoin

    VanEck Says Bitcoin Miners Are ‘Sitting on a Gold Mine’ as AI Demand Surges

    March 12, 2026
    Bitcoin

    Bitcoin holds steady while Hyperliquid quietly steals the spotlight

    March 12, 2026
    Leave A Reply Cancel Reply

    Top Posts

    How is the UK Commercial Property Market Performing?

    December 31, 2000

    How much are they in different states across the US?

    December 31, 2000

    A Guide To Becoming A Property Developer

    December 31, 2000
    Stay In Touch
    • Facebook
    • YouTube
    • TikTok
    • WhatsApp
    • Twitter
    • Instagram
    Latest Reviews
    Commodities

    Best Commodity Trading Apps of March 2025

    February 28, 2025
    Stock Market

    Why Is The Stock Market Down Today? How Beginners Can Turn Red Days Into Gains – Forbes Advisor

    August 20, 2025
    Bitcoin

    Bitcoin Price Crashes To $106,000, Bulls Eye Strong November

    November 3, 2025
    What's Hot

    This overlooked stock market move could outperform the S&P 500 in the next 90 days

    June 4, 2025

    BTC retraces near $118,000 as ETH and XRP sustain bullish momentum

    August 8, 2025

    Gold Breaks $4,000: How High Can It Go?

    October 8, 2025
    Most Popular

    Council discusses financial forecast, mandatory municipal income tax filing, possibly selling city property | News, Sports, Jobs

    August 10, 2024

    Soy Falls Most in a Month With Improving US Weather – BNN Bloomberg

    July 26, 2024

    UK Growth Concerns Limit GBP Upside By ExchangeRates.org.uk

    February 14, 2026
    Editor's Picks

    Olivier Osty – L’Agefi

    July 8, 2025

    BTC Charts Remain Strong While Tapzi Leads the Best Crypto Presale Wave

    December 13, 2025

    UK stock market plunges amid Trump tariff chaos as FTSE 100 suffers worst trading losses…

    April 4, 2025
    Facebook X (Twitter) Instagram Pinterest Vimeo
    • Get In Touch
    • Privacy Policy
    • Terms and Conditions
    © 2026 Invest Insider News

    Type above and press Enter to search. Press Esc to cancel.