Corporations report profits on their books. Those profits may or may not translate into higher stock prices because all earnings are not equal. Investors often talk about high or low quality earnings, a distinction that refers to the reliability and sustainability of the earnings stream, as well as whether it results from real sales or fancy bookkeeping. They also evaluate whether the earnings are commensurate with the risk taken. That is why just boosting earnings often does not translate into a higher stock price. Stock multiples can decline while earnings increase. Look at it this way: would you pay the same for a dollar of earnings made on an operation in some desolate country where revolutions and earthquakes occur regularly as for a corporate dollar earned in Texas? Probably not. As we said, some earnings are worth more than others. The market makes that decision, and it can be seen in the changing valuation of stocks over time. For a while, the oil industry’s numbers, despite what the books showed, looked terrible. Now they have improved to mediocre, which may seem okay, but really isn’t.
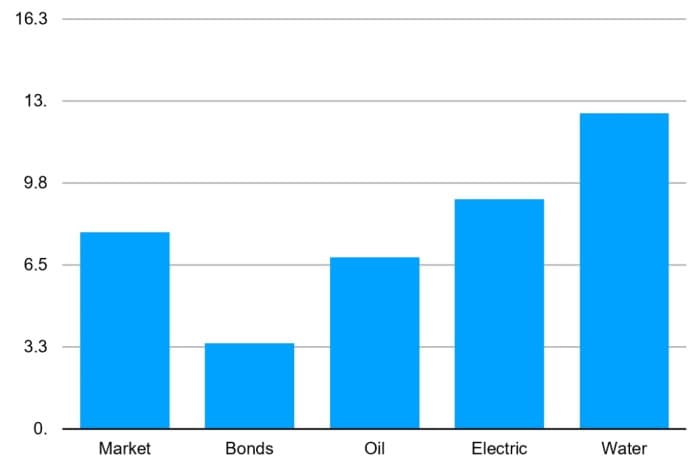
The first chart shows average annual total return (dividend plus stock appreciation) over 25 years (2000-2024 inclusive) for the total stock market, bonds, oil, electric utility, and water stocks. (The latter three categories are all ranked as low risk.) Over time, the stock market tends to outperform bonds.
Related: Russia to Import Gasoline from Asia as Drone Hits Cripple Refineries

The roughly 4 percentage point gap between the market and bonds in the 25-year-old period is in line with past experience.. But what is not is that the three low-risk stock categories did as well as they did relative to the market. Based on theory, we would have expected them to underperform the market by maybe 2 percentage points. Remember the theoretical order of returns: highest risk should earn the highest return, lower risk stocks a lower return, and bonds the lowest risk and lowest return. We suspect that the fact that this period encompassed three major downturns (one of which almost wrecked the global economy) made it more difficult for riskier stocks to outperform.
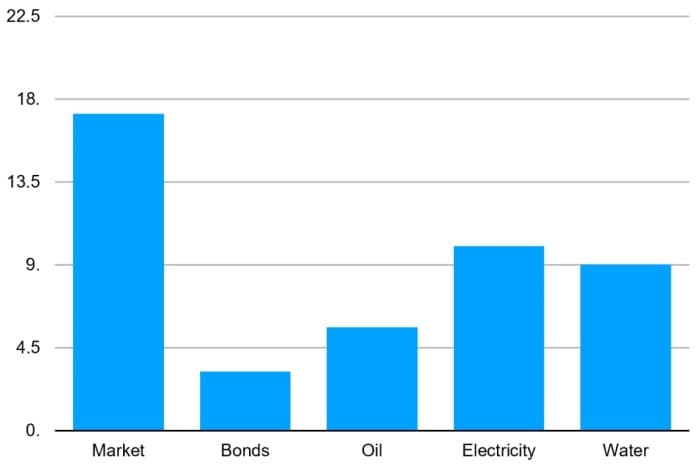
The next chart shows the average annual total returns for the 10 years ended 9/25/25. In this period, the market outperformed low-risk stocks and bonds by an exceptional margin. Again, the low-risk groups underperformed, but electricity and water outperformed oil.

Okay, those numbers going back decades may not be perfect because of missing data and changes in the indexes, but the numbers are good enough to suggest that:
- Low-risk investments do produce relatively low returns, although how much lower depends on market conditions.
- Electricity and water stock performance has exceeded that of oil stocks despite supposedly similar risk levels.
All three of the low-risk sectors have regularly made large capital investments to continue in business. They serve relatively slow or no-growth markets. Demand for their products is price elastic. NYU-Stern’s famous cost of capital spreadsheet shows electric and oil companies with almost the same cost of equity capital, and water having a significantly higher cost of equity capital. We don’t believe those estimates make sense. Taking a superficial view, oil companies work in difficult places, face hostile politicians, and suffer eventual losses of markets and threats of lawsuits for environmental damage. Electric companies make a good profit within a regulated framework, probably more than they deserve. Water companies plug leaks in pipes, and they get paid even when they tell their customers to use less.
Oil stock investors, we think, should ask themselves, “Are we really earning enough for the risk we are taking? Have we really made less money than investors in electric and water companies? Why?” We are not sure, but we suspect the answer might be, “Maybe those cost of capital estimates are wrong and you really aren’t earning your cost of capital.
You might ask, as well, “Who cares if we make more or less than other sectors? Well, it matters if you are competing with the other sector for business and for funds. Oil and electricity have begun to develop a zero-sum relationship; more electricity usage in transportation, for example, means less oil used and vice versa. Oil as an industry appears to be in its twilight while electricity is on the cusp of another boom (with boom defined as 3% growth in demand vs1% before). This growing competition probably has an impact on relative valuations.
That does not mean that electric companies don’t have risk issues that the market may be disregarding. There are two aspects of US utility regulation that seem excessively generous to the providers of utility equity capital: the % equity permitted to earn a return in the capital structure (40-50%) is way too high for a low-risk monopoly. (Japanese utilities operate with a 20% equity layer, and the lights stay on). Second, the regulatory-authorized returns allowed are also too high, and the risk-reward relationship seems broken. The spread between monopoly utilities’ allowed return on equity (ROE) and risk-free bonds has steadily widened while industry business risk has declined markedly. That’s not supposed to happen and engenders its own new risks, such as disgruntled customers beginning to self-generate.
As for the water companies, we (as opposed to the academic experts) think this is a really low-risk business that generates an unusually healthy return for the risk taken. As we said in a previous column, drill, baby, drill for water.
By Leonard Hyman and William Tilles for Oilprice.com
More Top Reads From Oilprice.com

