

The stock market has been booming since the end of the financial crisis 17 years ago. Aside from the five-week COVID-19 crash in February-March 2020 and the nine-month 2022 bear market, the Dow Jones Industrial Average (^DJI 0.95%), S&P 500 (^GSPC 1.33%), and Nasdaq Composite (^IXIC 1.59%) have been relatively unstoppable.
Of note, the stock market has performed exceptionally well under President Donald Trump. While 26 of the previous 33 presidential terms have featured gains for the Dow Jones Industrial Average or S&P 500, annualized returns under Trump have been among the best of any president, looking back over a century.
Image source: Getty Images.
But these outsize gains under Donald Trump have also been accompanied by historic bouts of volatility. The aforementioned COVID-19 crash, in which the S&P 500 lost 34% of its value in 33 calendar days, and his Liberation Day tariff and trade policy announcement in early April 2025 that saw the S&P 500 endure its fifth-steepest two-day percentage decline since 1950, are perfect examples.
The beginning of the Iran war on Saturday, Feb. 28, is another event under President Trump that’s clearly heightened stock market volatility and put investors on edge. But when examining the stock market objectively and with a wider lens, there’s a much bigger worry for Wall Street — one that carries a $7.8 trillion tag.
The Middle East conflict has investors on edge
Wars are unfortunate events that can cost people their lives and displace families. While the intangible costs of conflict are far greater than any monetary repercussions, the reality is that wars can lead to impacts far from where battles are being waged.
The decision by President Trump and Israel to mount an offensive against Iran can lead to unintended consequences for the U.S. economy and/or the stock market.
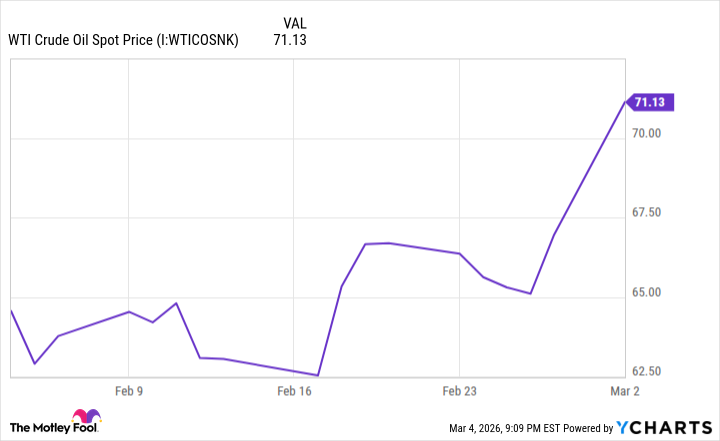
WTI Crude Oil Spot Price data by YCharts.
Topping the list is the potential for the spot price of crude oil to soar. According to the Energy Information Administration, approximately 20 to 21 million barrels of crude oil and petroleum liquids pass through the Strait of Hormuz daily. Since the attacks began, Iran has largely halted oil exports, thereby putting up to 20% of the world’s daily petroleum needs at risk.
The law of supply and demand states that if a high-demand product, such as oil, decreases in supply, its price would be expected to rise until demand tapers. In simpler terms, the U.S.-Israeli war with Iran is likely to raise per-gallon prices at the gas pump, as well as for households that rely on petroleum-based products for heating.
Higher energy commodity costs risk reigniting U.S. inflation, which may prompt the Federal Reserve to think twice about lowering interest rates. This would be a problem, given that most investors are counting on the central bank’s easing cycle to fuel corporate borrowing and ongoing investment in high-growth initiatives (e.g., artificial intelligence).
The Iran war also increases generalized uncertainty. Investors favor stock market transparency above all else. However, there aren’t any set timelines with military conflicts, which tends to weigh on investor sentiment.

Image source: Getty Images.
This $7.8 trillion warning looms large for Wall Street
While the U.S.-Israeli war with Iran is clearly impacting the stock market and increasing volatility, there’s an objectively bigger worry for Wall Street that could tip stocks over the edge. The question is: Are investors paying attention?
Each quarter, the Board of Governors of the Federal Reserve publishes a laundry list of economic data. Among these are the total financial assets held in money market funds.
Money market funds are a type of mutual fund that invests in ultra-safe, high-quality assets, such as short-term U.S. Treasury bills, municipal debt, and certificates of deposit (CDs). It’s the type of security income-seeking or volatility-avoiding investors tend to make.
As of the end of the third quarter of 2025, data from the Fed shows that an all-time high of $7.774 trillion was held in money market funds.
$7.8 Trillion is now sitting in Money Market Funds, a new all-time high 🚨🚨 pic.twitter.com/kkKfkW5G4j
— Barchart (@Barchart) January 15, 2026
On the one hand, cash is expected to flow into money market funds if interest rates (and, by extension, bond yields) are rising. When the nation’s central bank was aggressively tackling the highest inflation rate in four decades by raising its federal funds target rate between March 2022 and July 2023, bond yields soared.
But since September 2024, the Fed has lowered interest rates on six occasions — yet total financial assets in money market funds have continued to climb at a steady pace. Though we’d expect lower yields to slow or reverse inflows into money market funds, this hasn’t been the case.
This $7.8 trillion figure is the ultimate gauge of investor sentiment and uncertainty. While the argument can be made that money market fund assets are rising solely because institutional investors are keeping their capital in interest-bearing accounts on the sidelines, it’s far more likely that the sizable uptick we’ve observed has to do with investors being worried about the heightened probability of a stock market correction or crash event.
Keeping in mind that no correlated event or data point can ever guarantee a directional move on Wall Street, several indicators are foreshadowing trouble.
S&P 500 Shiller PE Ratio hits 2nd highest level in history 🚨 The highest was the Dot Com Bubble 🤯 pic.twitter.com/Lx634H7xKa
— Barchart (@Barchart) December 28, 2025
For example, the S&P 500’s Shiller Price-to-Earnings (P/E) Ratio has been hovering between 39 and 41 for months. On top of this being more than double its 155-year, back-tested average of 17.34, it marks the second-priciest stock market in history. The five prior occurrences when the Shiller P/E exceeded 30 were all eventually followed by declines in the Dow Jones Industrial Average, S&P 500, and/or Nasdaq Composite ranging from 20% to 89%.
Money market fund flows have also accurately predicted trouble for Wall Street. A significant increase in inflows into money market funds has been observed before several big stock market corrections this century. Since Sept. 30, 2022, assets held in money market funds have surged by nearly $2.7 trillion.
While the Iran war may dominate headlines, this $7.8 trillion figure is an objectively bigger worry that suggests investors are losing faith in the stock market.