

- Bitcoin rises above $116,000, supported by demand from whales holding between 100 and 1,000 BTC, but then retreats slightly.
- Ethereum extends its recovery above $4,500 amid steady ETF inflows.
- XRP breaks above a three-month descending trendline resistance, affirming the recovery potential toward its $3.66 record high.
Bitcoin (BTC) hovers around the $115,000 level on Wednesday after surging above $116,000 earlier in the day amid rising risk-on sentiment in the broader cryptocurrency market. Ethereum (ETH), the largest smart contract token, on the other hand, has extended its recovery above $4,500 as bulls target its record high of $4,956 reached on August 24.
Interest in Ripple (XRP) remains steady, allowing bulls to push for gains above the $3.00 critical level, while aiming for a breakout toward the $3.66 all-time high reached on July 18.
Data spotlight: Bitcoin whales support price recovery as institutional demand steadies
Bitcoin wallets holding between 100 and 1,000 BTC are steadily accumulating, adding more than 65,000 BTC in the past seven days, bringing the cohort’s total holdings to 3.65 million BTC. According to XWIN Research Japan’s post on CryptoQuant, demand for Bitcoin has picked up pace, with the price hovering around $112,000.
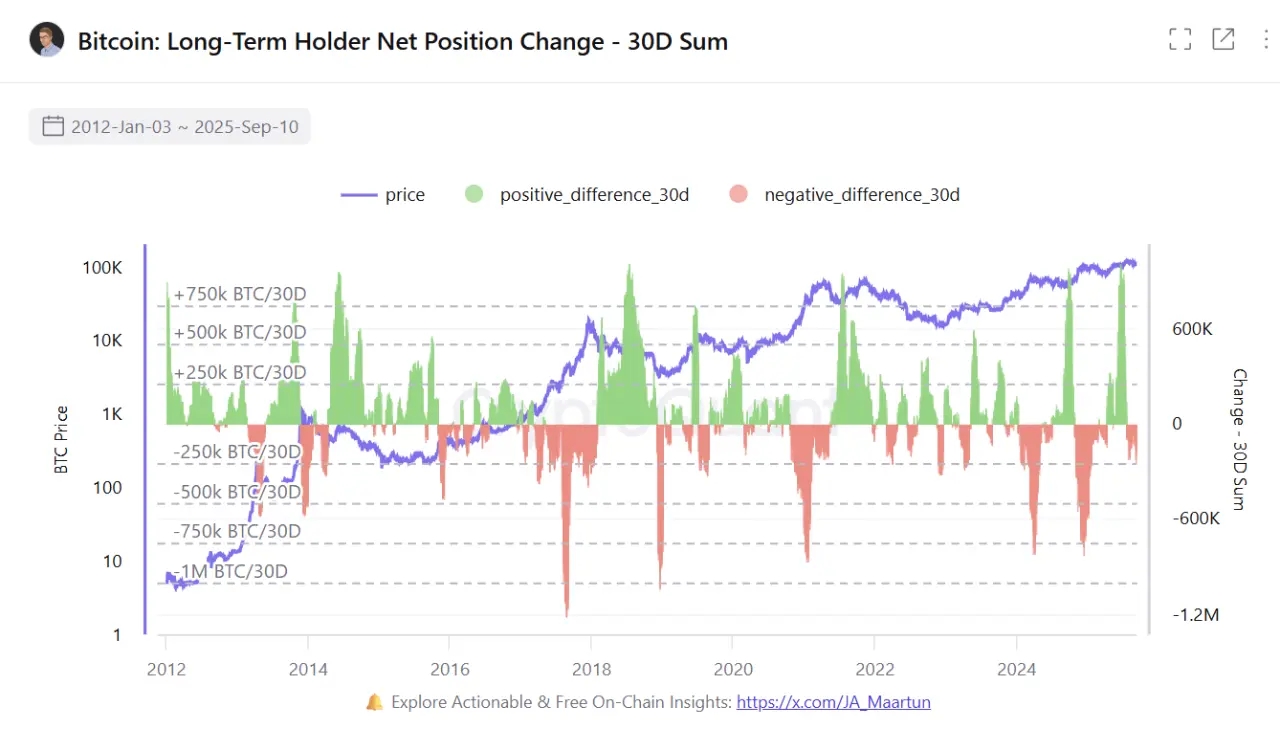
Bitcoin Long-Term Holder Net Position | Source: CryptoQuant
“Exchange Netflow data provides additional evidence. Net outflows—BTC withdrawn from exchanges – have dominated recently, signaling that investors are moving coins into cold storage rather than keeping them liquid for trading,” XWIN Research Japan’ highlighted.
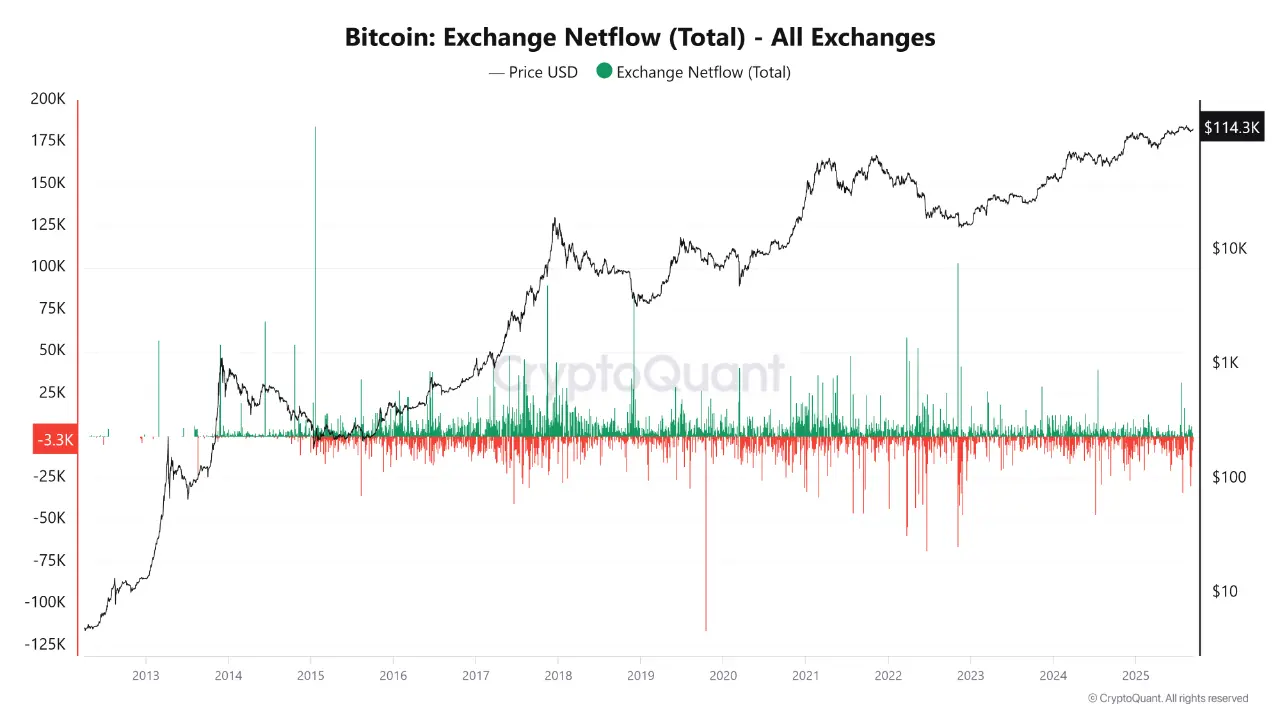
Bitcoin Exchange Netflow | Source: CryptoQuant
If this trend remains intact, it could create a supply squeeze – the recipe for higher prices. Still, short-term corrections can be expected, especially if derivatives leverage overheats.
Apart from large volume holders, demand for Bitcoin spot Exchange Traded Funds (ETFs) in the United States (US) has surged this week, totaling $1.7 billion so far. According to SoSoValue data, inflows into all 12 BTC ETFs totaled $553 million on Thursday.
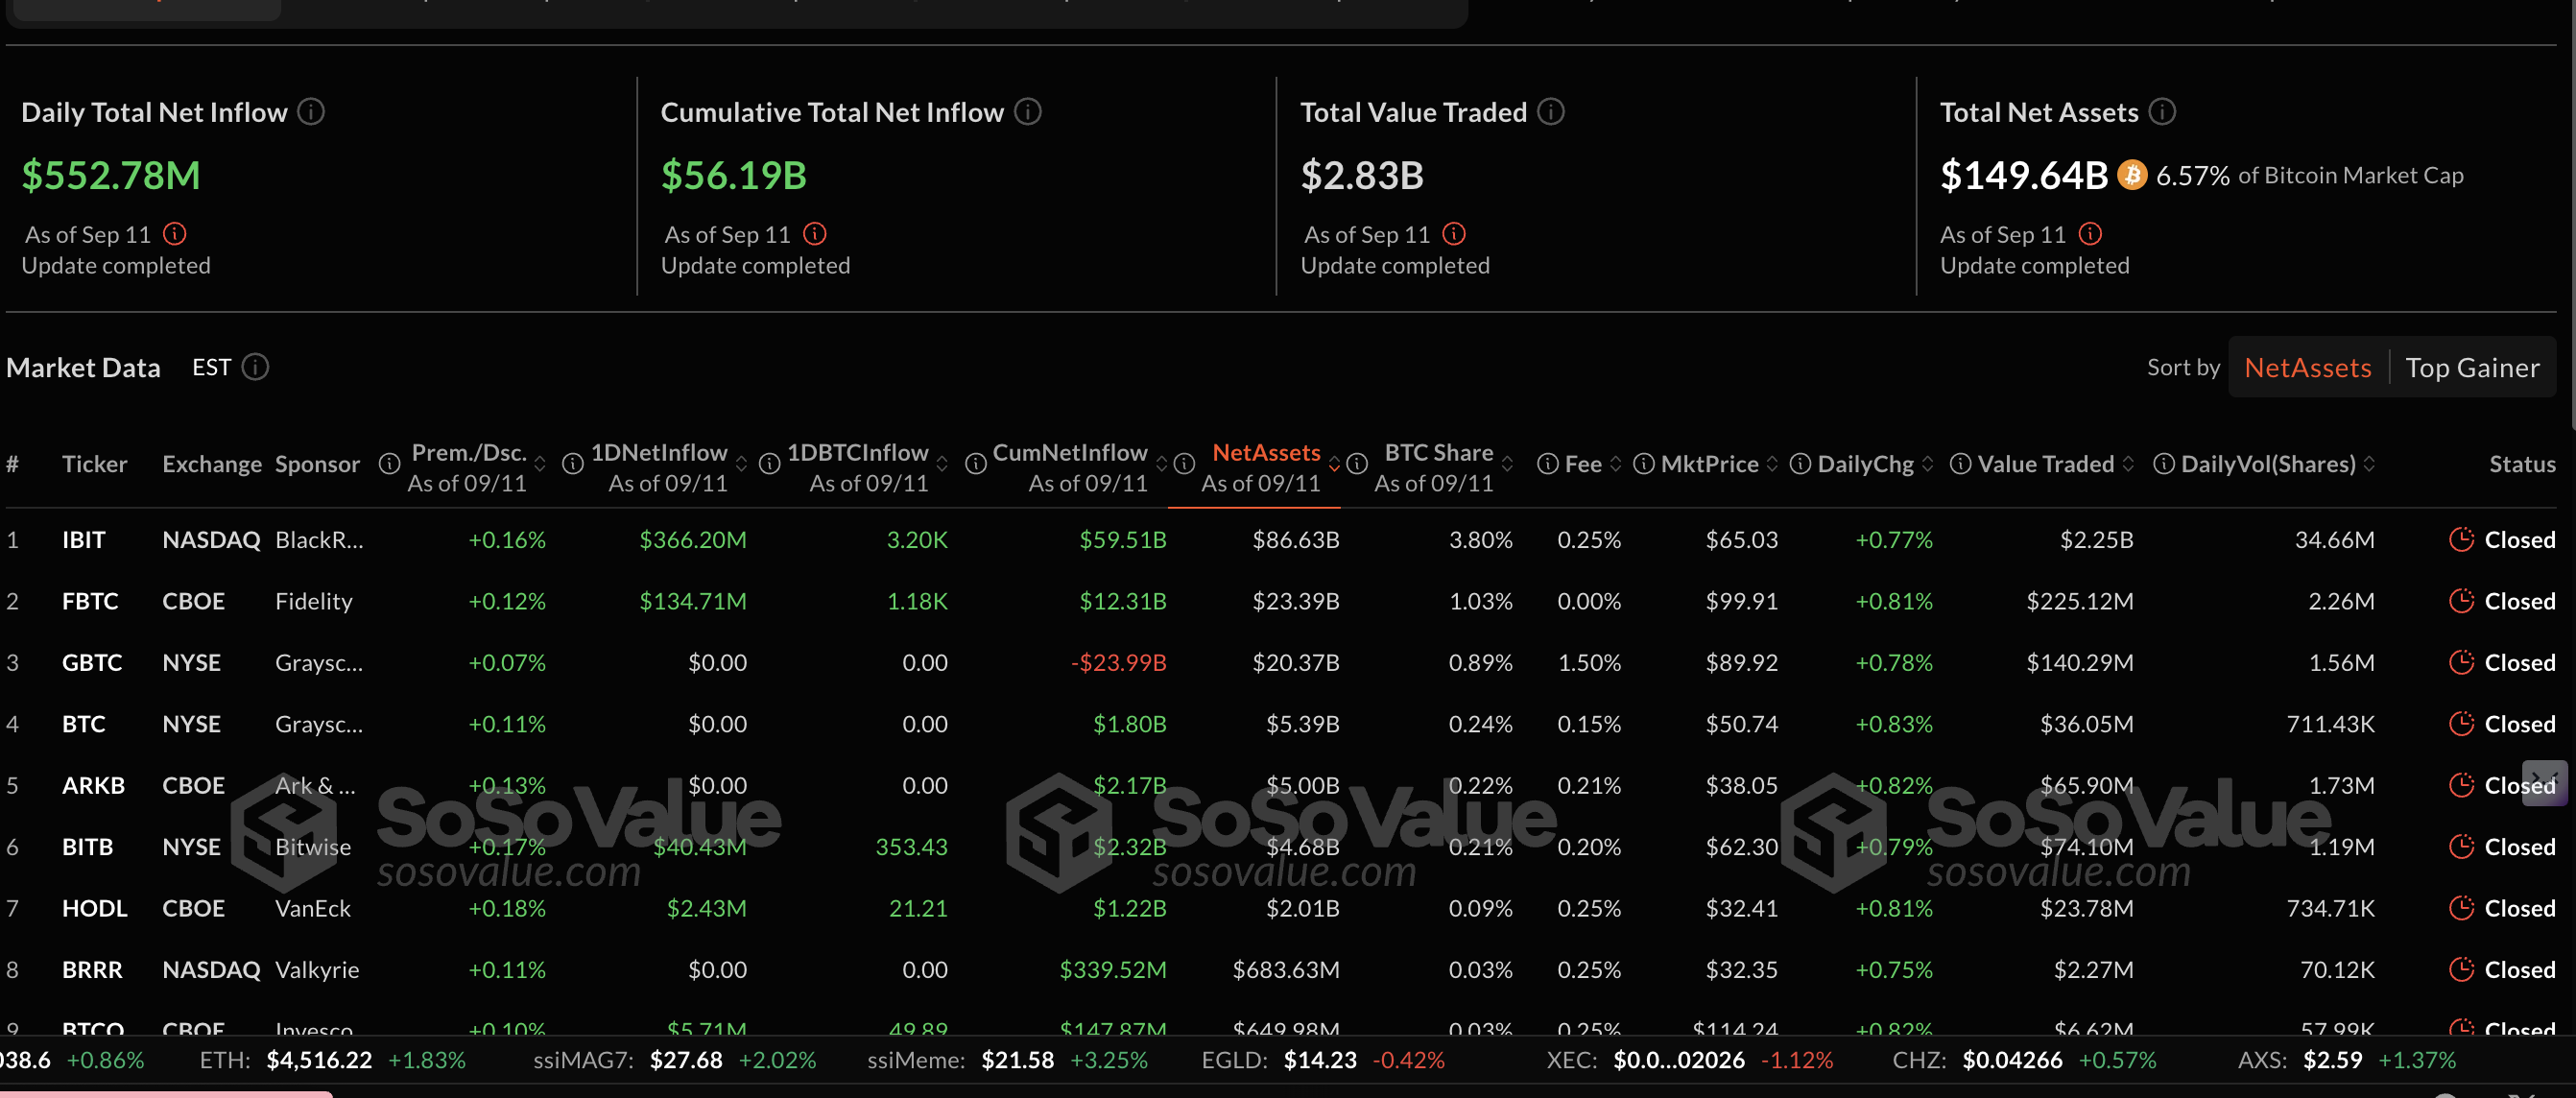
Bitcoin ETF stats | Source: SoSoValue
As risk-on sentiment improves ahead of the Federal Reserve’s (Fed) interest-rate decision next week, demand for Bitcoin and related financial products has the potential to grow, steadying the uptrend toward the psychological $120,000 level.
Ethereum spot ETFs in the US have now experienced their third consecutive day of inflows, following six days of outflows, which reflects a significant shift in sentiment. The chart below shows that ETH ETFs saw $113 million in total daily inflows on Thursday, bringing the cumulative net inflow to $12.96 billion and the total net assets to $28.51 billion.
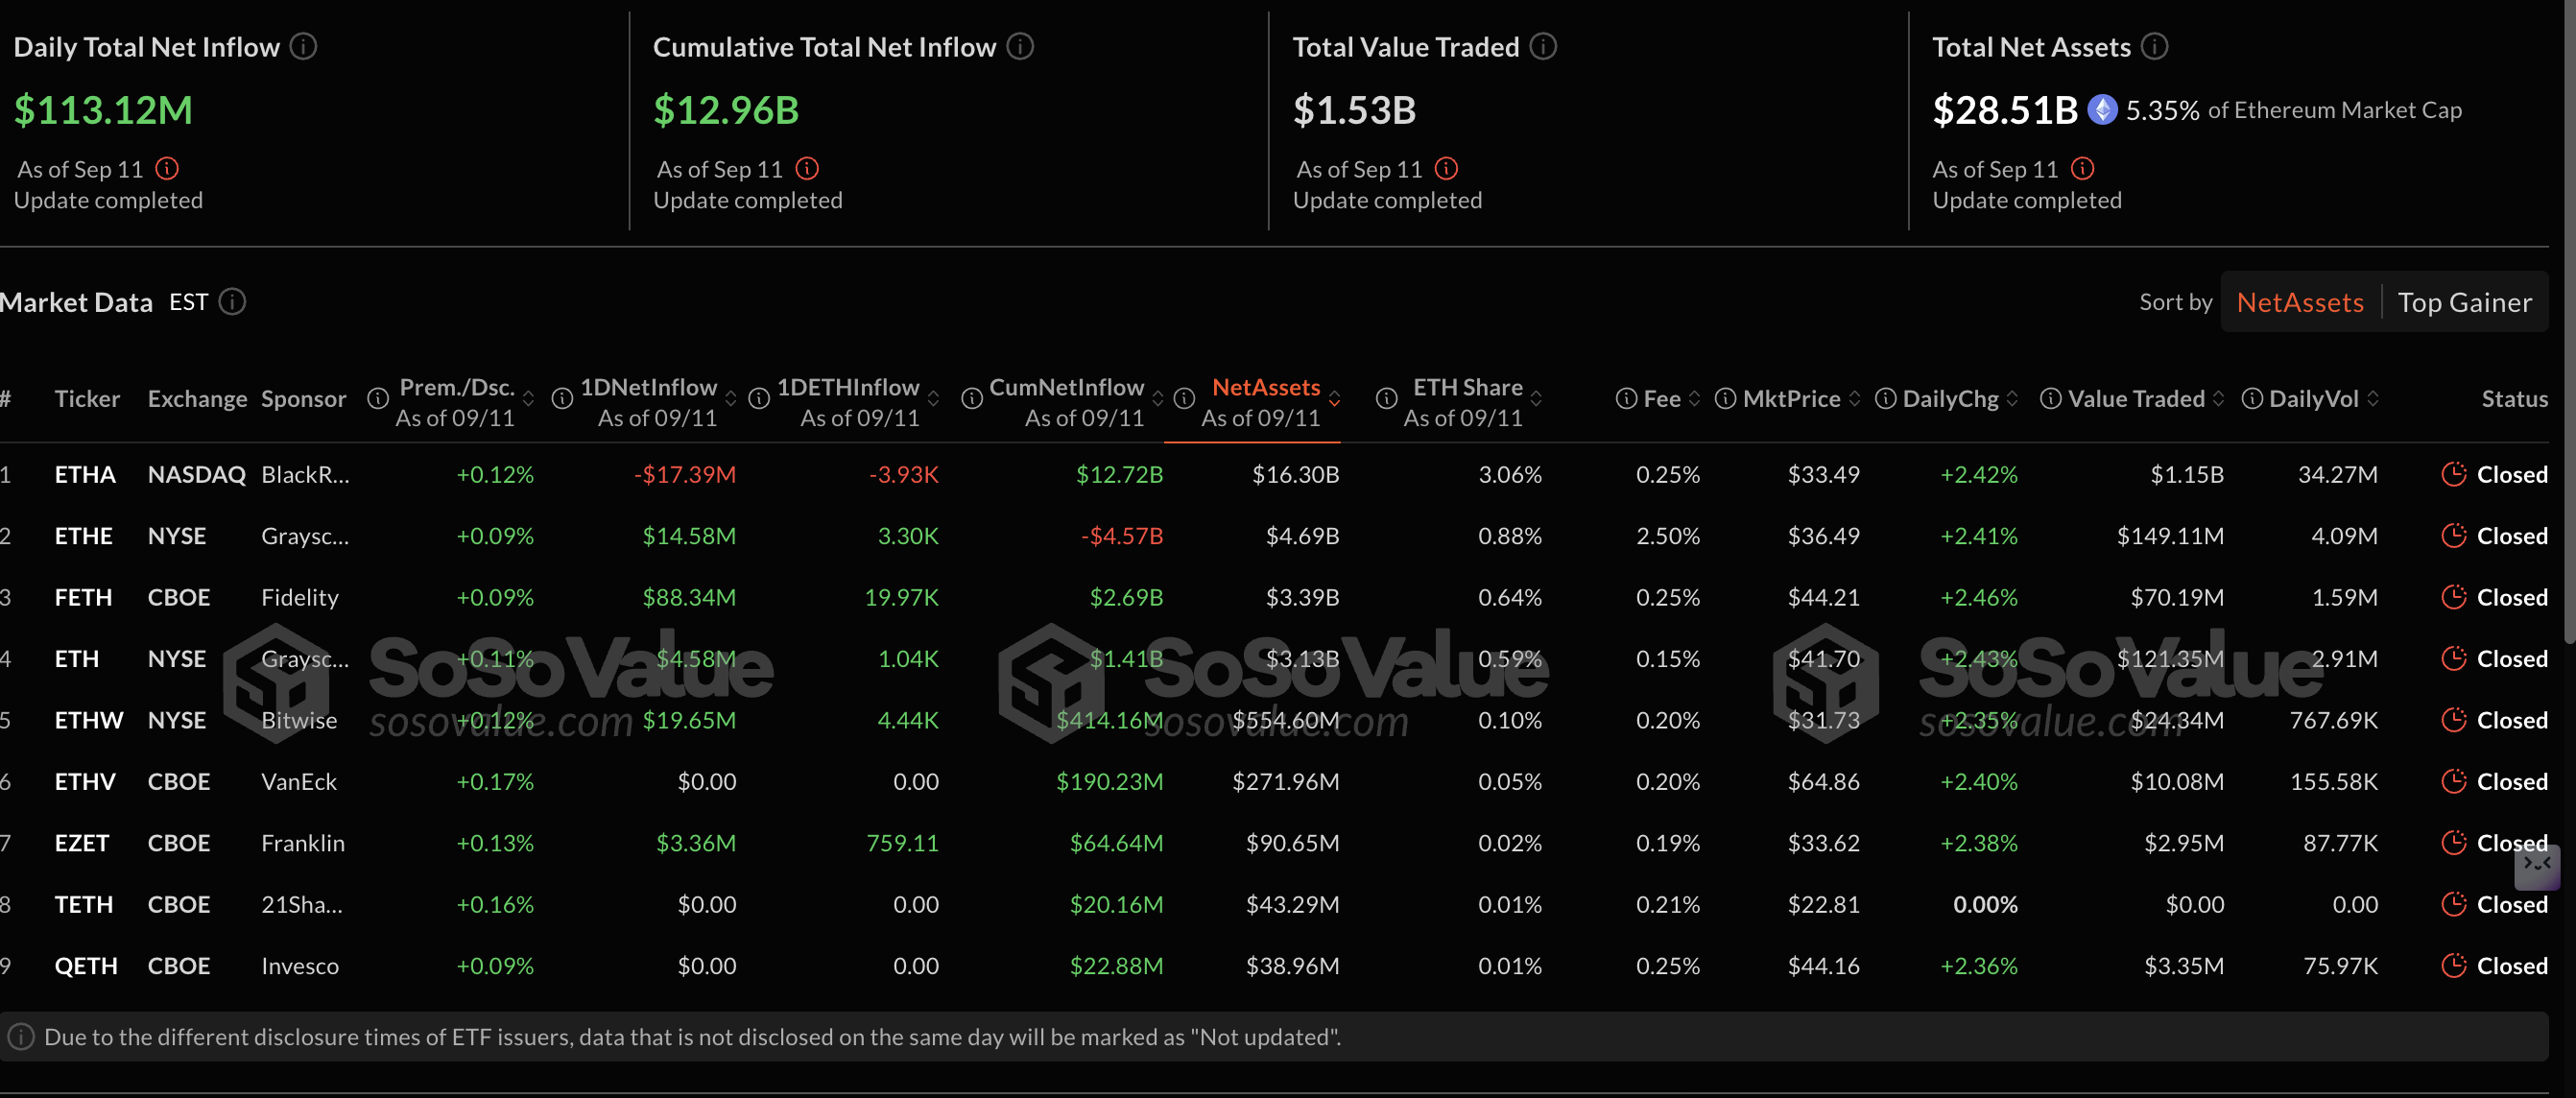
Ethereum ETF stats | Source: SoSoValue
Meanwhile, retail interest in XRP remains relatively high compared to last week. CoinGlass data shows the XRP futures Open Interest (OI) averaging $8.51 billion on Thursday, up from $7.37 billion on Sunday.
The rising OI trend suggests that investors bet in XRP’s ability to sustain its recovery to the record high of $3.66 reached on July 18.
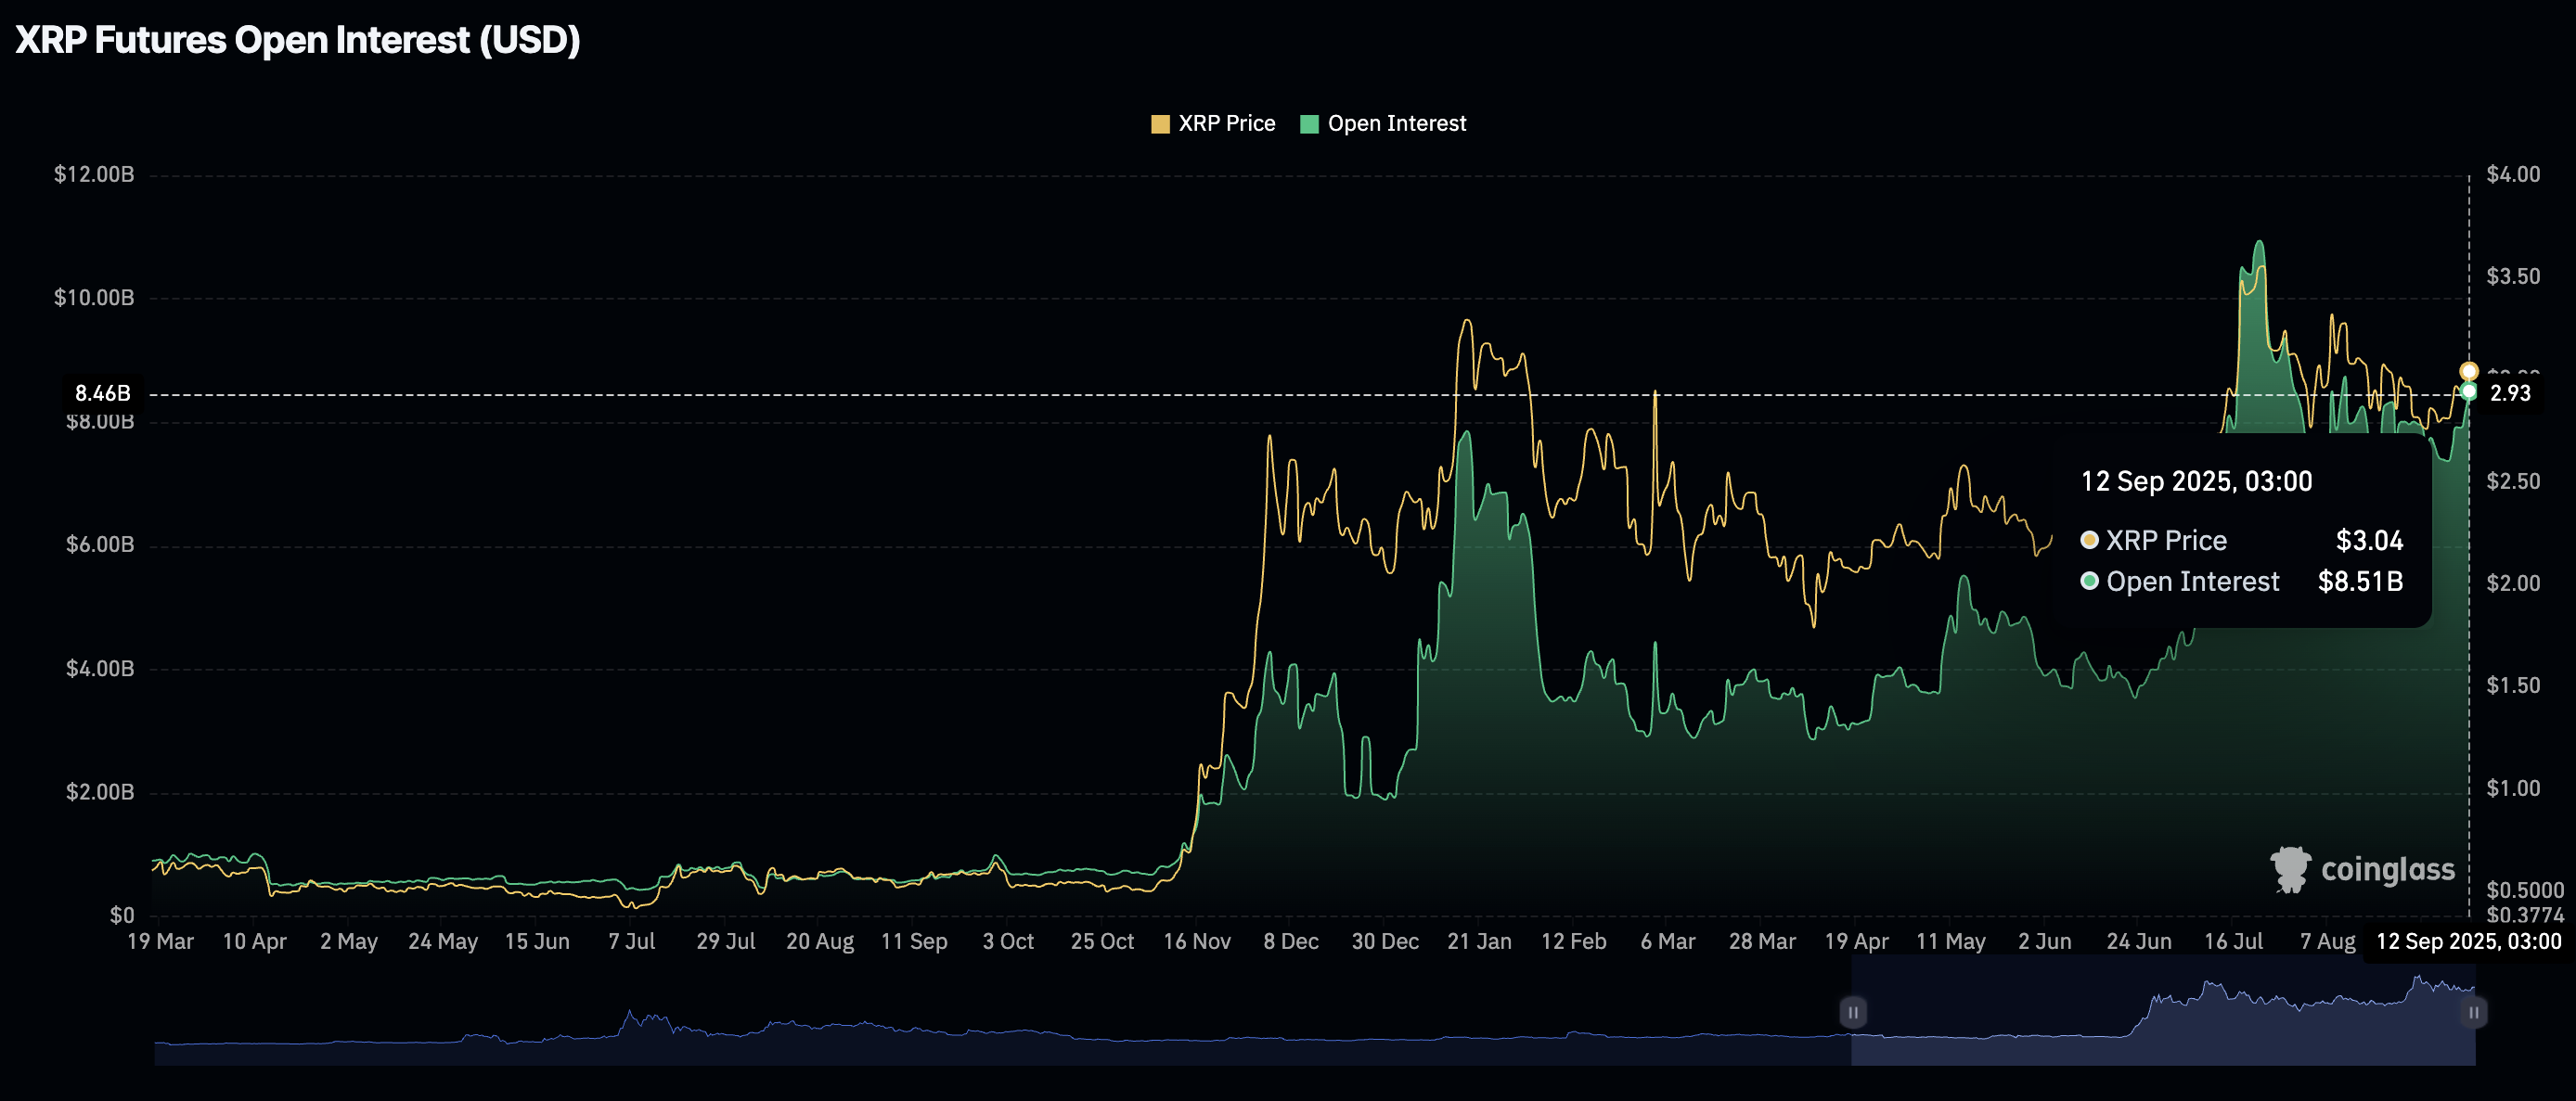
XRP Futures Open Interest | Source: CoinGlass
Chart of the day: Can Bitcoin sustain uptrend toward $120,000?
Bitcoin holds slightly above $115,000 after correcting from an intraday high of $116,331. The largest cryptocurrency by market capitalization has, in the last two weeks, flipped several key levels into support, including the 100-day Exponential Moving Average (EMA) at $111,012, the 50-day EMA at $113,117 and the round-number level at $114,500, underscoring positive market sentiment.
The Moving Average Convergence Divergence (MACD) indicator reinforces the bullish outlook with a buy signal that has been sustained since Sunday on the daily chart, while the Relative Strength Index (RSI) position at 57 indicates steady bullish momentum.
Traders will look for a daily close above $116,000 to ascertain the strength of the uptrend toward the $120,000 level. Still, market participants should be cautious as the RSI shows signs of declining toward the 50 midline, which could mean a reduction in buying pressure .
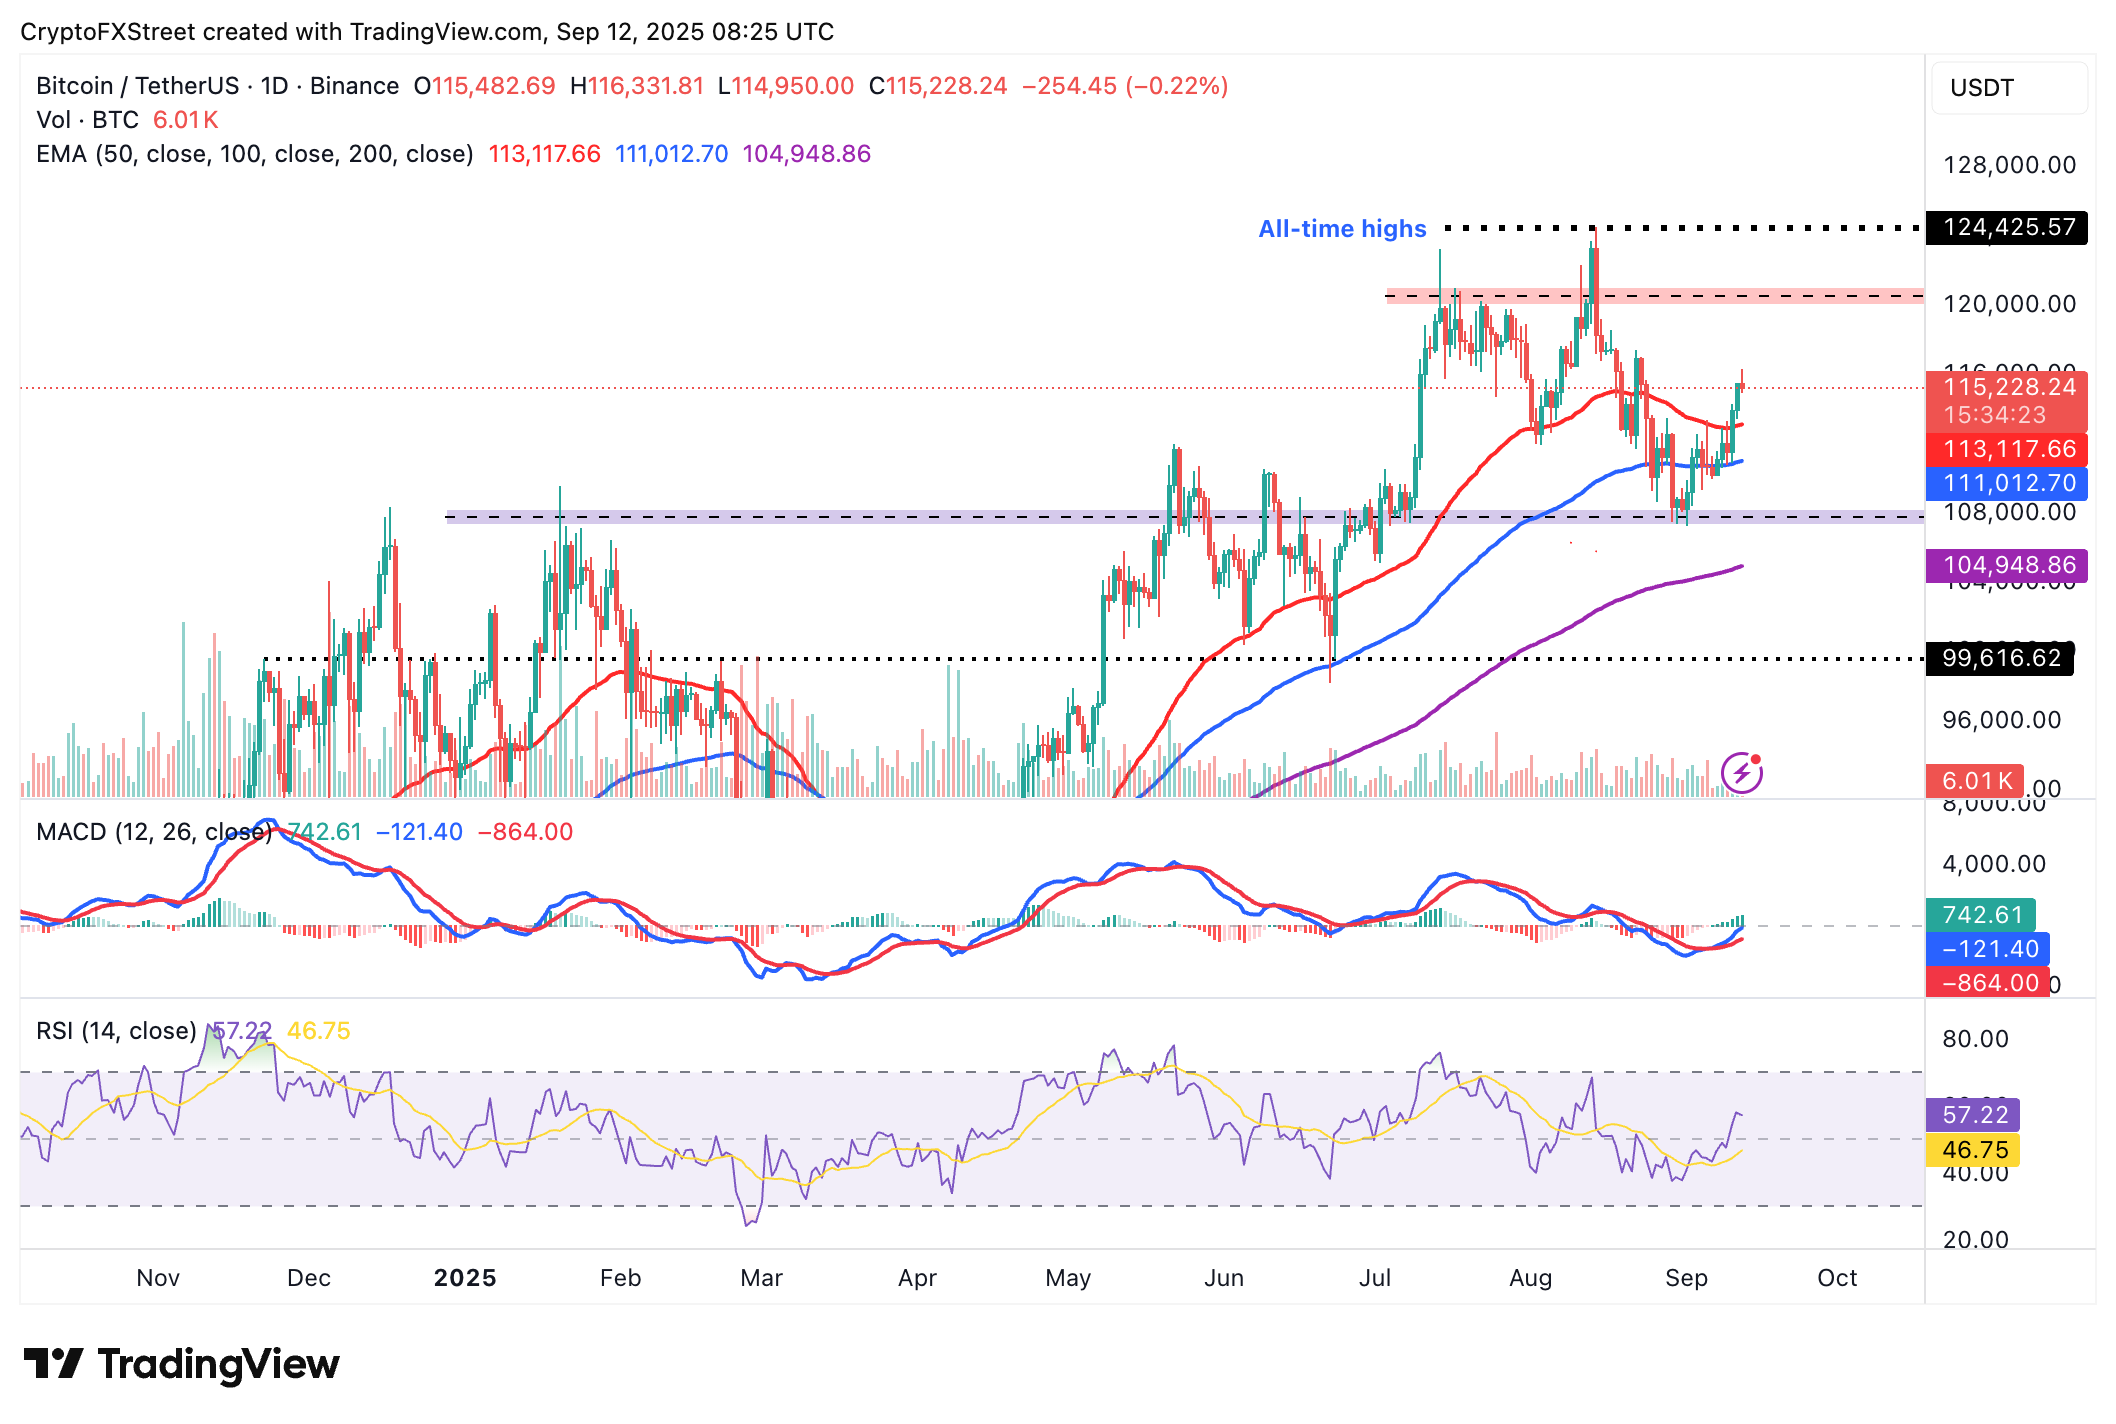
BTC/USDT daily chart
Altcoins update: Ethereum, XRP uphold recovery
Ethereum price holds above $4,500 at the time of writing on Friday. Its short-term outlook is bullish, supported by a steadily rising RSI at 58 on the daily chart. Higher RSI readings toward overbought territory suggest that mean buying pressure is increasing in support of the uptrend, eyeing a breakout to the $4,956 all-time high.
Traders will consider increasing exposure if the blue MACD line crosses above the red signal line. A buy signal encourages investors to position themselves ahead of a potential price increase.
If short-term profit-taking takes centre stage, a reversal could ensue as Ethereum trims recent gains. The 50-day EMA at $4,126 and the 100-day EMA at $3,680 are in line to provide support.
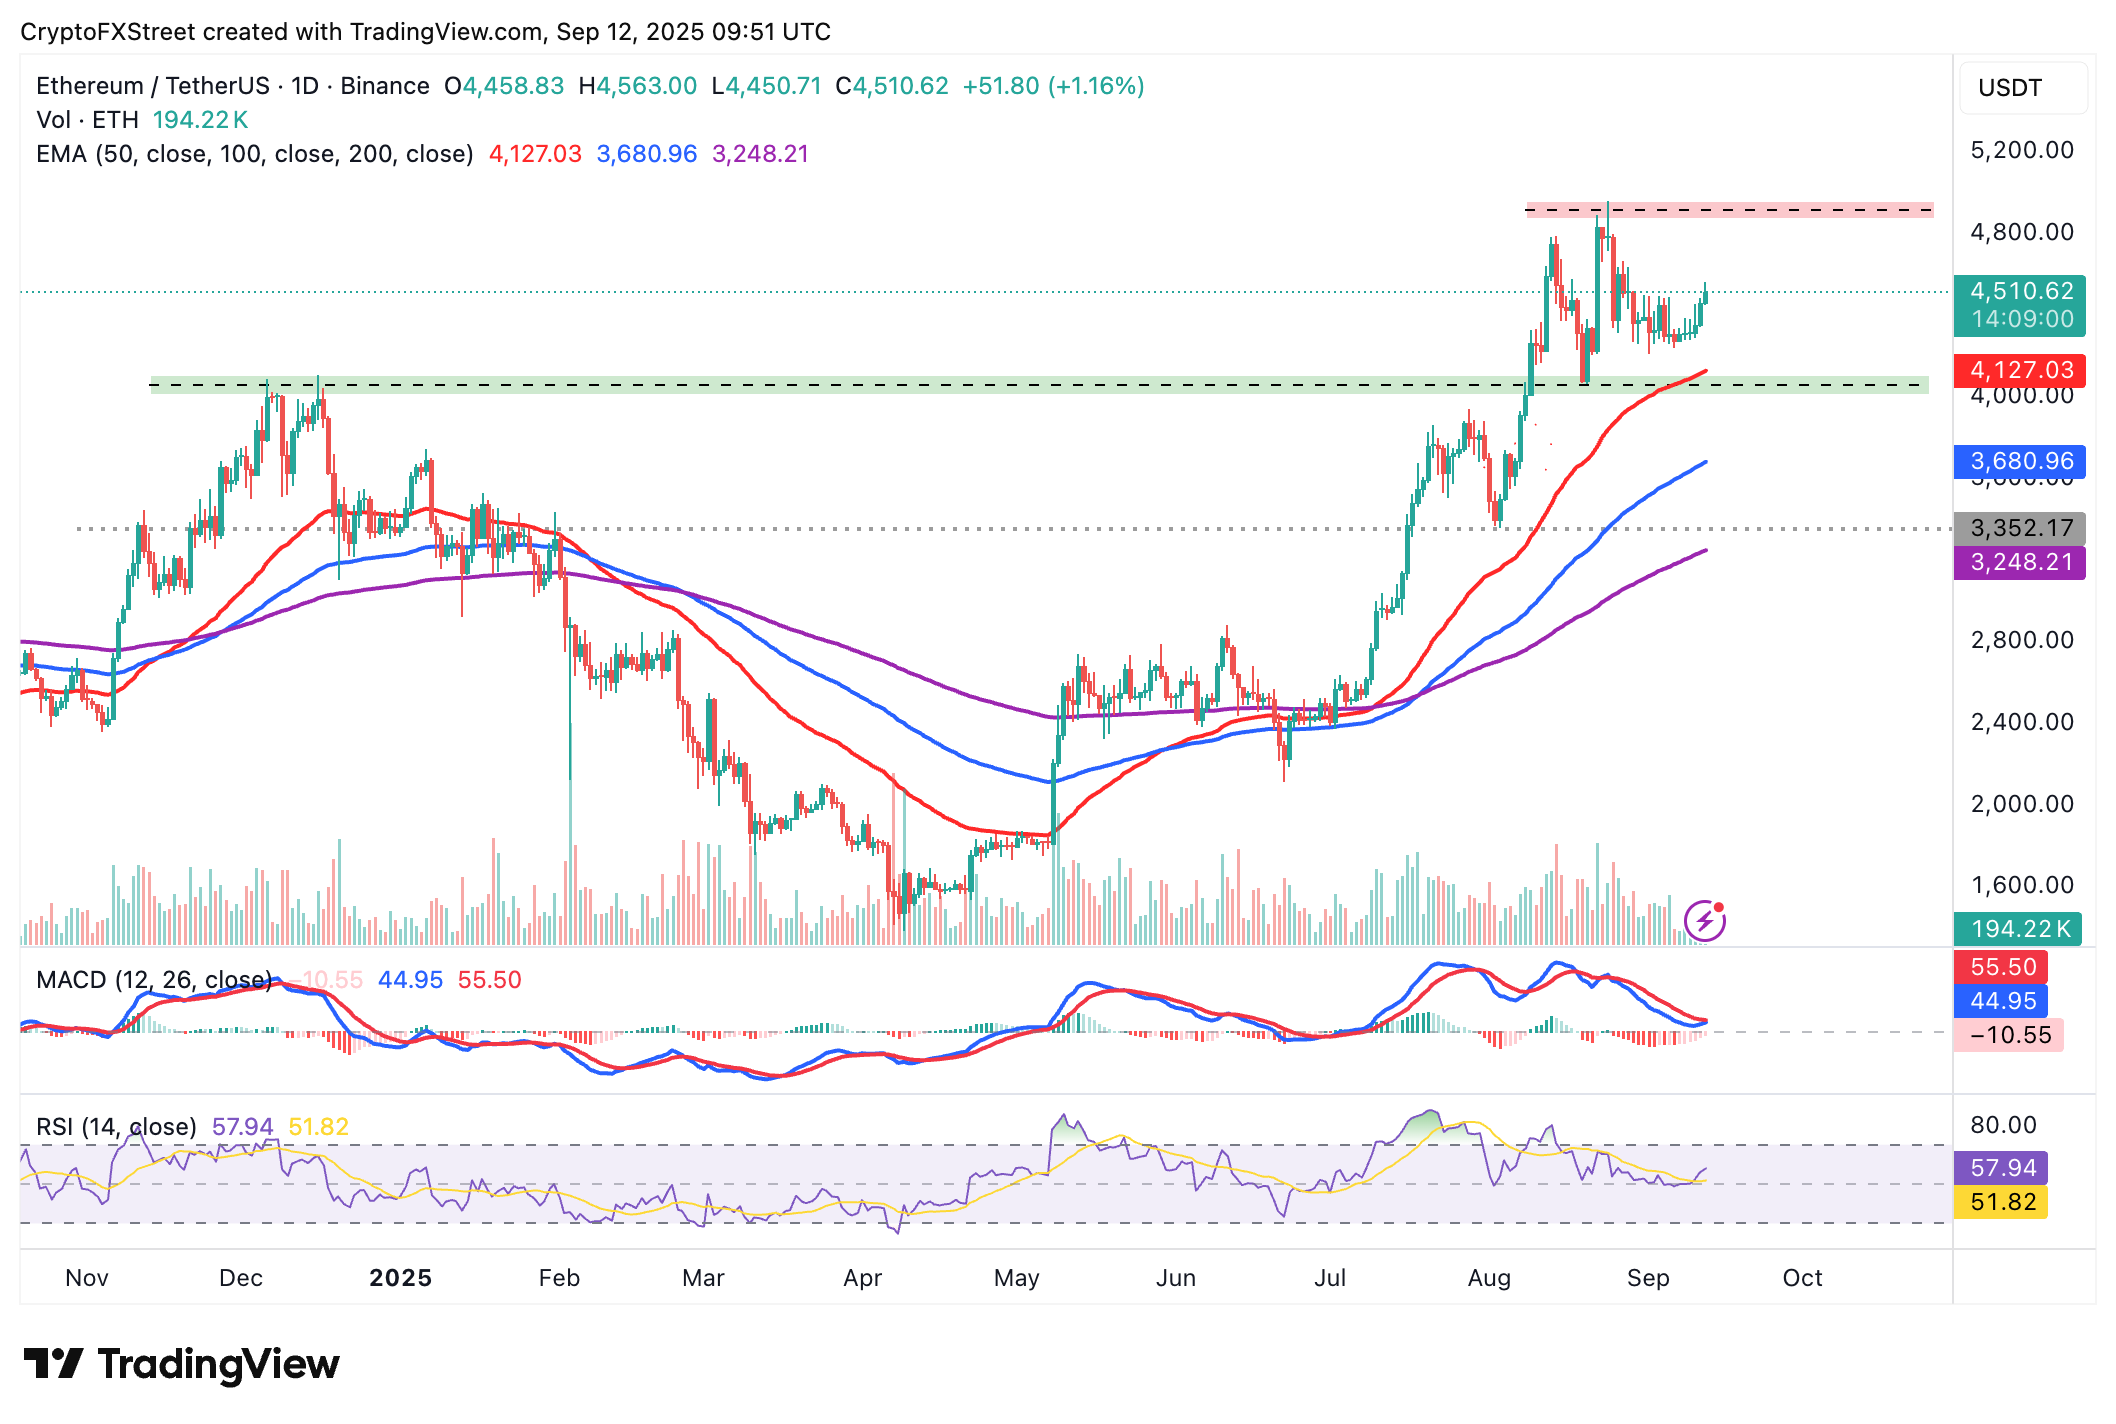
ETH/USDT daily chart
As for XRP, the path of least resistance appears to be upward, bolstered by a break above a three-month descending trendline on the daily chart. The cross-border money remittance token also holds above its key moving averages, including the 50-day EMA at $2.92, the 100-day EMA $2.79 and the 200-day EMA at $2.54, affirming bullish sentiment in crypto markets.
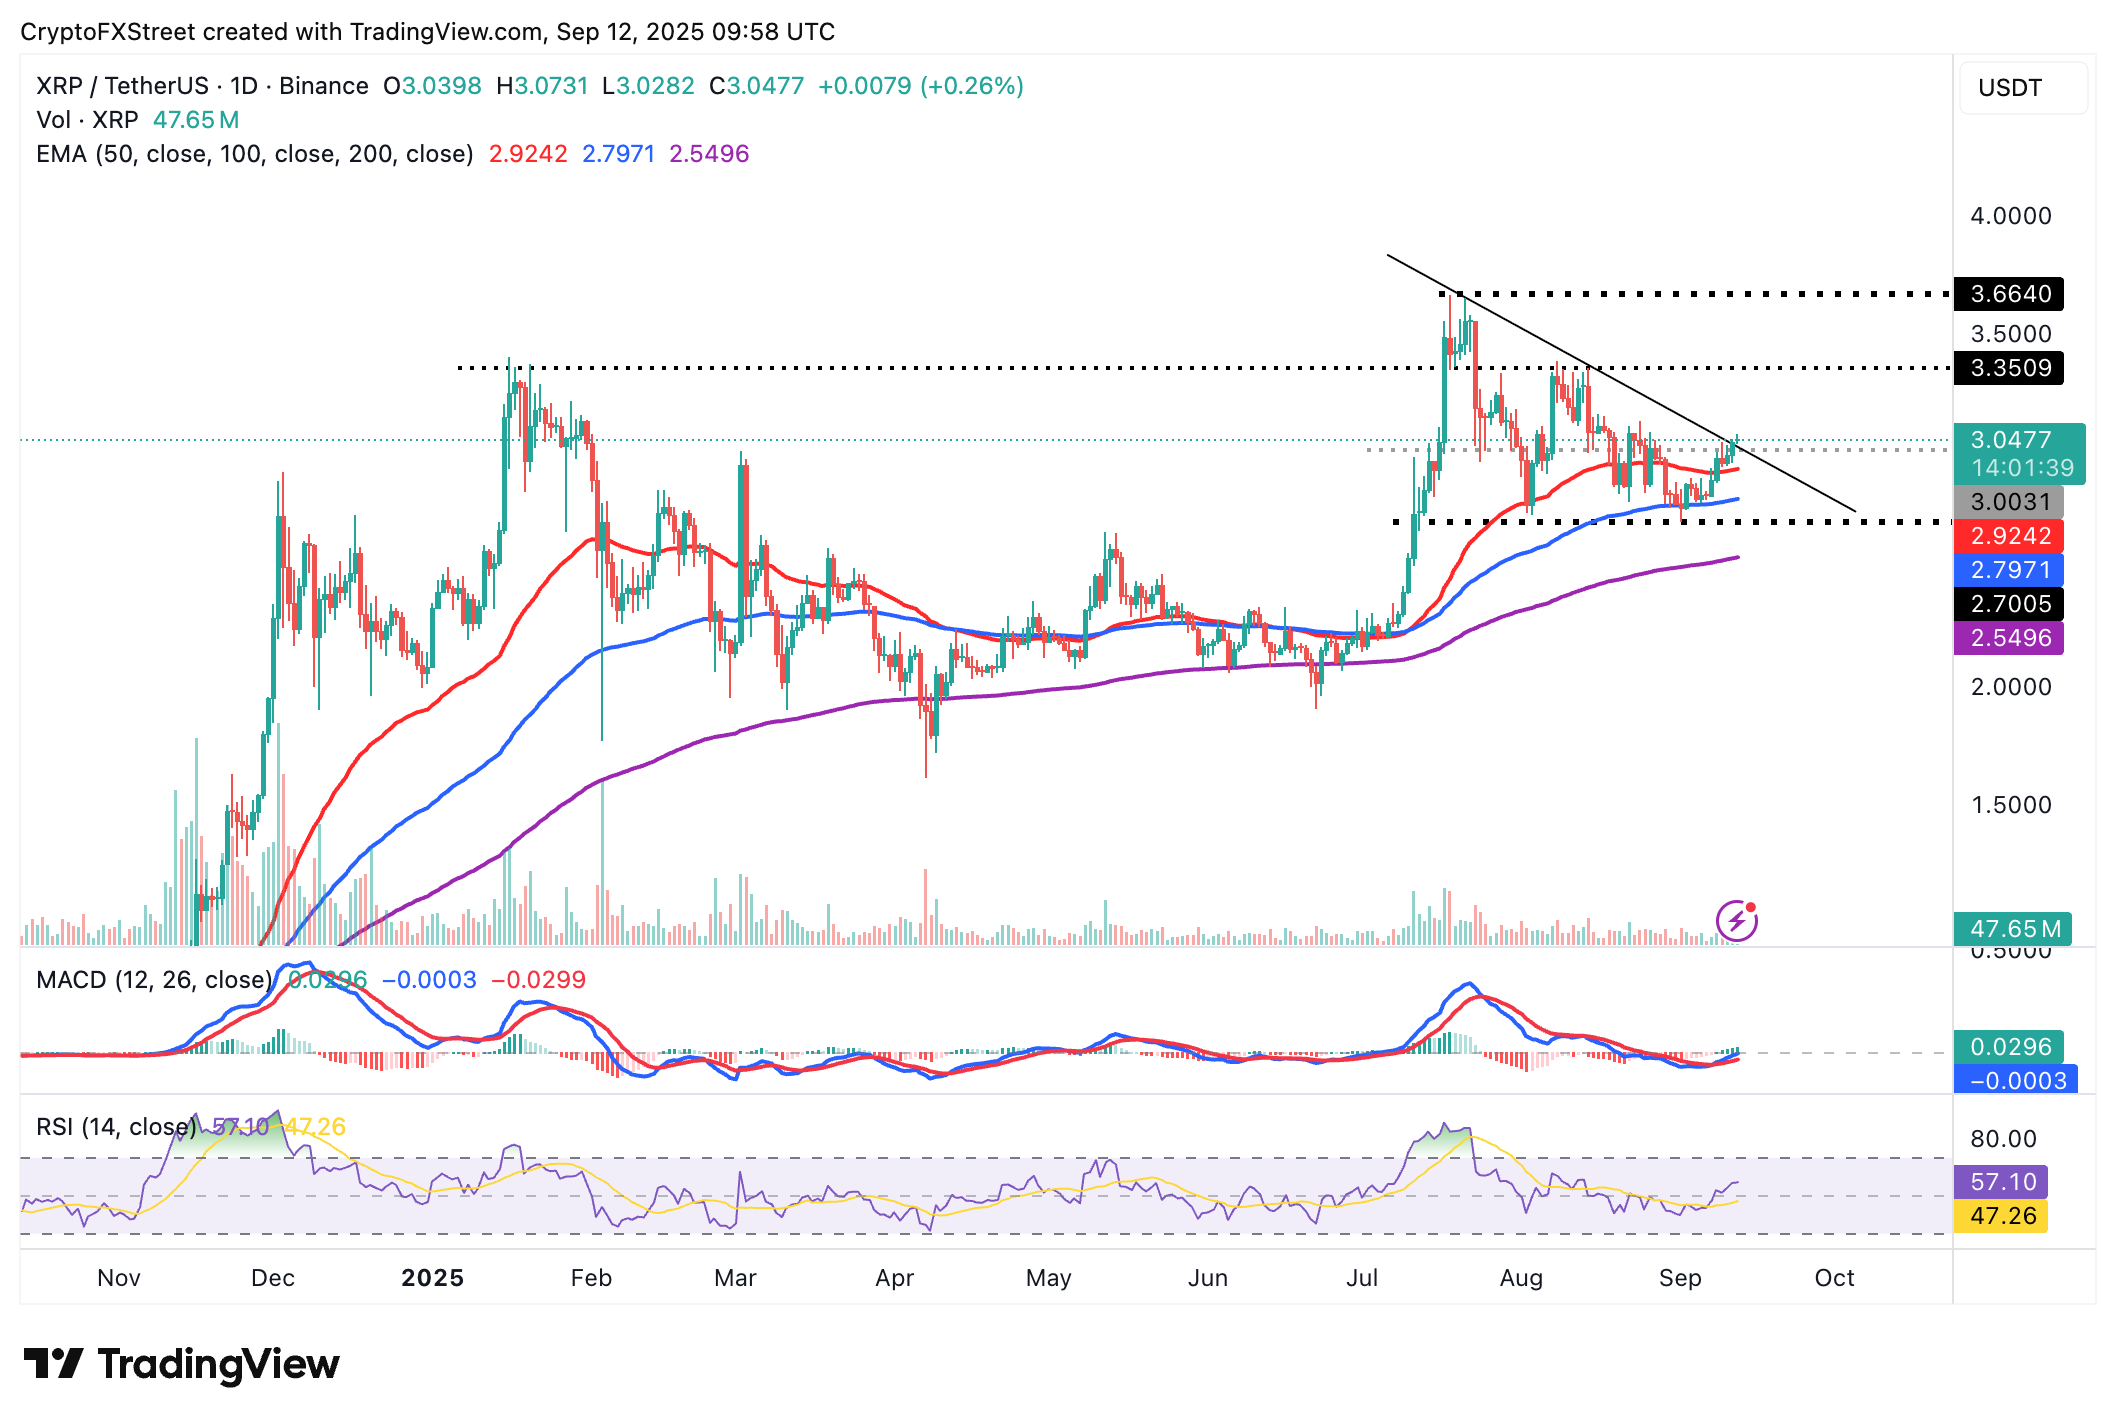
XRP/USDT daily chart
With the MACD sustaining a buy signal from Monday, also on the daily chart, XRP has the potential to steady the recovery toward resistance at $3.35, which was previously tested in mid-August. An extended break would likely drive XRP closer to its record high of $3.66.