

On-chain data shows the Bitcoin Illiquid Supply has shot up to a new all-time high (ATH) recently. Here’s what this could mean for the asset.
Around 74% Of The Circulating Bitcoin Supply Is Currently ‘Illiquid’
In a new post on X, analyst James Van Straten discussed the latest trend in Bitcoin’s Illiquid Supply. The concept of ‘liquidity’ for Bitcoin comes from the on-chain analytics firm Glassnode, which defines it for an entity as “the ratio of cumulative outflows and cumulative inflows over the entity’s lifespan.”
An ‘entity’ here refers to a collection of addresses that Glassnode has determined to belong to the same investor. Based on the value of this metric, entities can be put into one of three categories: Illiquid, Liquid, and Highly Liquid. Entities with a history of high inflows but low outflows are put inside the Illiquid category. More formally, the indicator’s value must be less than 0.25 for the majority of an investor’s holdings to be considered part of the Illiquid Supply.
On the other end of the spectrum is the Highly Liquid Supply, made up of the balance of the entities who have their liquidity ratio greater than 0.75 (that is, those with outflows that are similar to inflows). The Illiquid Supply essentially represents the frozen part of the BTC supply that is unlikely to move in the near future, as it’s locked in the wallets of investors who have little history of selling. In contrast, the Highly Liquid Supply corresponds to the tokens that are constantly churning around.
In between the two is the Liquid Supply, which contains entities participating in a varying degree of trading activity (liquidity ratio greater than 0.25 and less than 0.75).
Note that the methodology that the analytics firm employs means that there are no abrupt changes in categories at the cutoffs; the transition between supply happens in a smooth manner (for example, an entity with a liquidity ratio exactly equal to 0.25 contributes 50% to Illiquid and 50% to Liquid).
Now, here is the chart shared by Van Straten that shows the trends in the Illiquid and Liquid + Highly Liquid Supplies for Bitcoin:
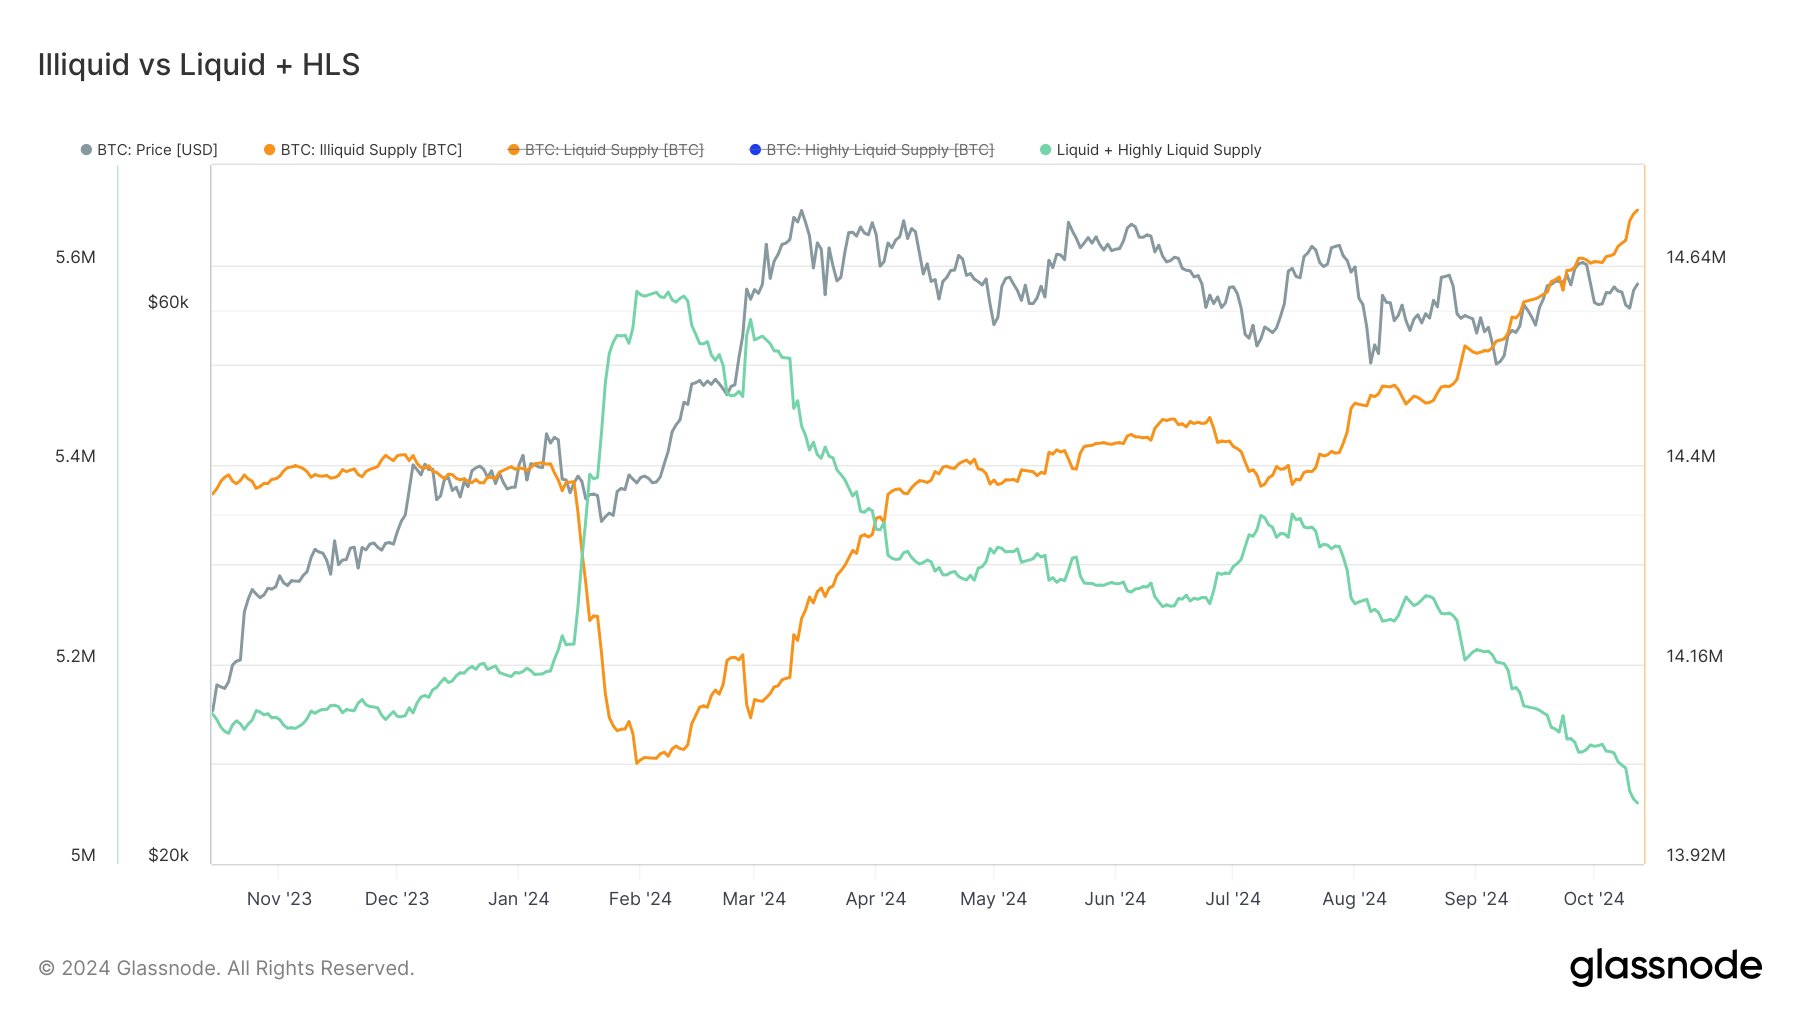
The two metrics appear to have been going opposite ways in recent months | Source: @btcjvs on X
As is visible in the above graph, the Bitcoin Illiquid Supply has been on the rise since the early months of the year, implying the diamond hands have been buying up coins. Following the latest continuation of the increase, the metric has set a new ATH of around 14.7 million, which is equivalent to around 74% of the entire BTC supply in circulation.
“The fascinating part is the divergence continues to grow between illiquid vs liquid + highly liquid,” notes the analyst. “Available trading supply continues to diminish while market sentiment continues to favour HODLing.”
BTC Price
At the time of writing, Bitcoin is trading at around $64,900, up more than 3% over the past week.

Looks like the price of the coin has gone through some recovery recently | Source: BTCUSDT on TradingView
Featured image from Dall-E, Glassnode.com, chart from TradingView.com