Close Menu
Invest Insider News
    Facebook X (Twitter) Instagram
    Friday, March 13
    Facebook X (Twitter) Instagram Pinterest Vimeo
    Invest Insider News
    • Home
    • Bitcoin
    • Commodities
    • Finance
    • Investing
    • Property
    • Stock Market
    • Utilities
    Invest Insider News
    Home»Bitcoin»Bitcoin Hasn’t Reached Bull Cycle Top Yet, Quant Explains Why
    Bitcoin

    Bitcoin Hasn’t Reached Bull Cycle Top Yet, Quant Explains Why

    July 16, 20243 Mins Read


    According to the trend in an on-chain indicator, an analyst has explained how Bitcoin may still need to reach the top of the current bull cycle.

    Bitcoin aSOPR Hasn’t Yet Reached Levels Associated With Past Cycle Tops

    As explained by an analyst in a CryptoQuant Quicktake post, the Bitcoin Adjusted Spent Output Profit Ratio (aSOPR) is yet to go as high as during the tops of the previous cycles.

    The “SOPR” refers to a popular on-chain indicator that basically tells us whether cryptocurrency investors are selling their tokens at a profit or loss right now.

    This metric works by going through the blockchain history of each coin sold to see what price it was transacted at before. If this previous price for any coin was less than the price it’s being sold now, then its sale is leading to profit realization.

    Similarly, coins of the opposite type would imply loss-taking. The SOPR calculates the ratio between such profits and losses being realized across the network to provide a net situation.

    When the indicator’s value is greater than 1, the investors are selling their coins at a net profit. On the other hand, values under this mark suggest the dominance of loss realization in the market.

    In the context of the current discussion, the SOPR itself isn’t of interest here, but rather a modified form called the “aSOPR.” This indicator adjusts the SOPR data to exclude transactions of coins made within an hour of their previous transfers (hence the “adjusted” in the front of the name).

    Now, here is a chart that shows the trend in the 90-day exponential moving average (EMA) Bitcoin aSOPR over the past few years:

    Bitcoin aSOPR
    The 90-day EMA value of the metric appears to have been going down in recent weeks | Source: CryptoQuant

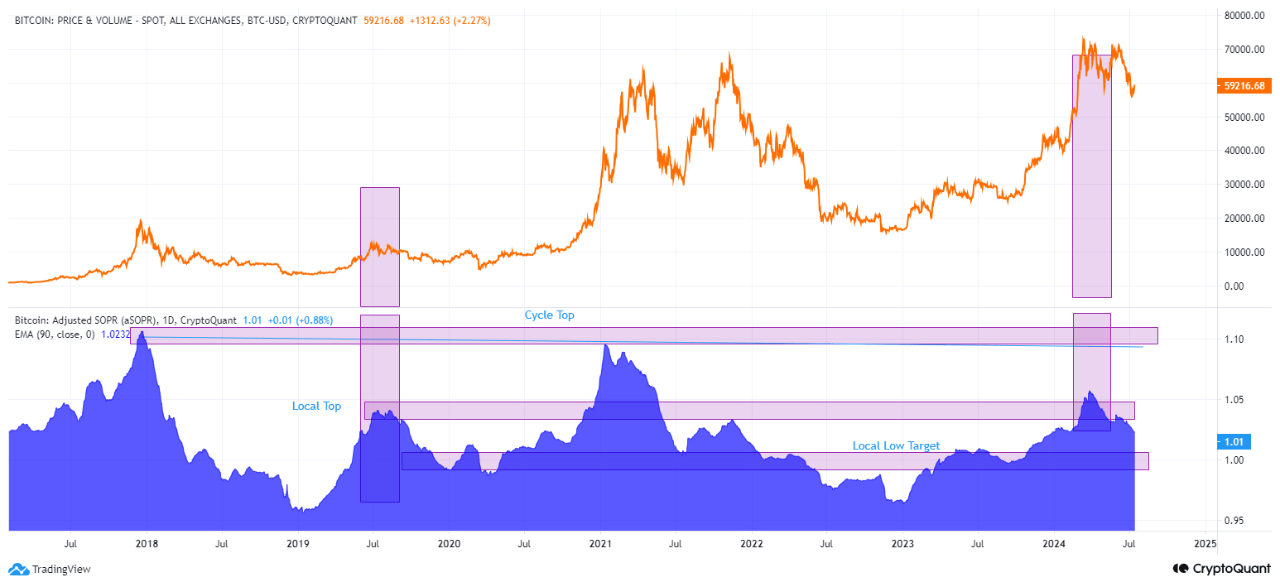
    As displayed in the above graph, the 90-day EMA Bitcoin aSOPR had observed a rise alongside the rally earlier in the year. This implies that investors had ramped up their profit-taking as the coin’s price surged to a new all-time high (ATH).

    With the bearish momentum that BTC has been facing since then, though, the indicator has also seen a cooldown. At the peak of the profit realization spree, the indicator had crossed the 1.05 mark, but now it has come down to just 1.01.

    As the quant has highlighted in the chart, the bull run tops in 2017 and 2021 occurred as the indicator approached a value of 1.1. The recent high in the indicator has been significantly below this mark.

    The peak level seen in the recent rally was similar to the one witnessed during the peak of the April 2019 rally. This recovery surge from the previous cycle had only been a prelude to the real bull run that would come later, so BTC may also see something similar play out this time.

    BTC Price

    Bitcoin has enjoyed a rally of around 5% in the past 24 hours, taking its price back above the $63,000 level.

    Bitcoin Price Chart
    Looks like the price of the coin has seen an uplift recently | Source: BTCUSD on TradingView

    Featured image from Dall-E, CryptoQuant.com, chart from TradingView.com


    Source link

    Share. Facebook Twitter Pinterest LinkedIn Tumblr Email
    Previous ArticleEbook | The global metals and mining outlook: a cross-commodity view
    Next Article Derivatives And Commodities Brokerage Market is Set to Fly High

    Related Posts

    Bitcoin

    Metaplanet Expands Bitcoin Strategy with New Venture Firm

    March 13, 2026
    Bitcoin

    Federal Reserve Basel III Plan Gives BTC a 1250% Risk Weight

    March 13, 2026
    Bitcoin

    JPMorgan Flags Divergence Between Bitcoin and Gold ETF Flows

    March 13, 2026
    Leave A Reply Cancel Reply

    Top Posts

    How is the UK Commercial Property Market Performing?

    December 31, 2000

    How much are they in different states across the US?

    December 31, 2000

    A Guide To Becoming A Property Developer

    December 31, 2000
    Stay In Touch
    • Facebook
    • YouTube
    • TikTok
    • WhatsApp
    • Twitter
    • Instagram
    Latest Reviews
    Finance

    Santander attacks car finance redress scheme as it scraps UK results

    October 29, 2025
    Bitcoin

    Market update: Bitcoin rises after US-EU announce framework trade agreement

    July 27, 2025
    Stock Market

    Fear fades in US stocks, but history shows quick return to calm unlikely

    August 13, 2024
    What's Hot

    MARRIOTT INTERNATIONAL’S 600TH PROPERTY IN ASIA PACIFIC EXCLUDING CHINA CELEBRATES FLAGSHIP BRAND WITH THE OPENING OF ADELAIDE MARRIOTT HOTEL

    August 22, 2024

    Ipswich property next to golf club for sale at £900,000

    March 23, 2025

    Oracle Q2 Earnings Preview: Major Test for Its AI Story

    December 10, 2025
    Most Popular

    U.S. officials focused on enforcement as trade talks continue, USDA undersecretary says

    August 13, 2025

    USA Rare Earth (USAR) Stock Is Falling Wednesday: What’s Driving The Action? – USA Rare Earth (NASDAQ:USAR)

    October 15, 2025

    Bitcoin Hits 6-Week High After Trump’s Pro-Crypto Comments

    July 29, 2024
    Editor's Picks

    Bitcoin Hitting $200,000 in 2025 Is a ‘Conservative’ Bet: Bernstein

    October 23, 2024

    Gold Powers Through $3,600 as Bullish Momentum Shows No Signs of Slowing

    September 8, 2025

    Ethereum se déteste du bitcoin alors que les mesures clés deviennent vertes

    May 29, 2025
    Facebook X (Twitter) Instagram Pinterest Vimeo
    • Get In Touch
    • Privacy Policy
    • Terms and Conditions
    © 2026 Invest Insider News

    Type above and press Enter to search. Press Esc to cancel.