
1. What is the Bitcoin Rainbow Chart?
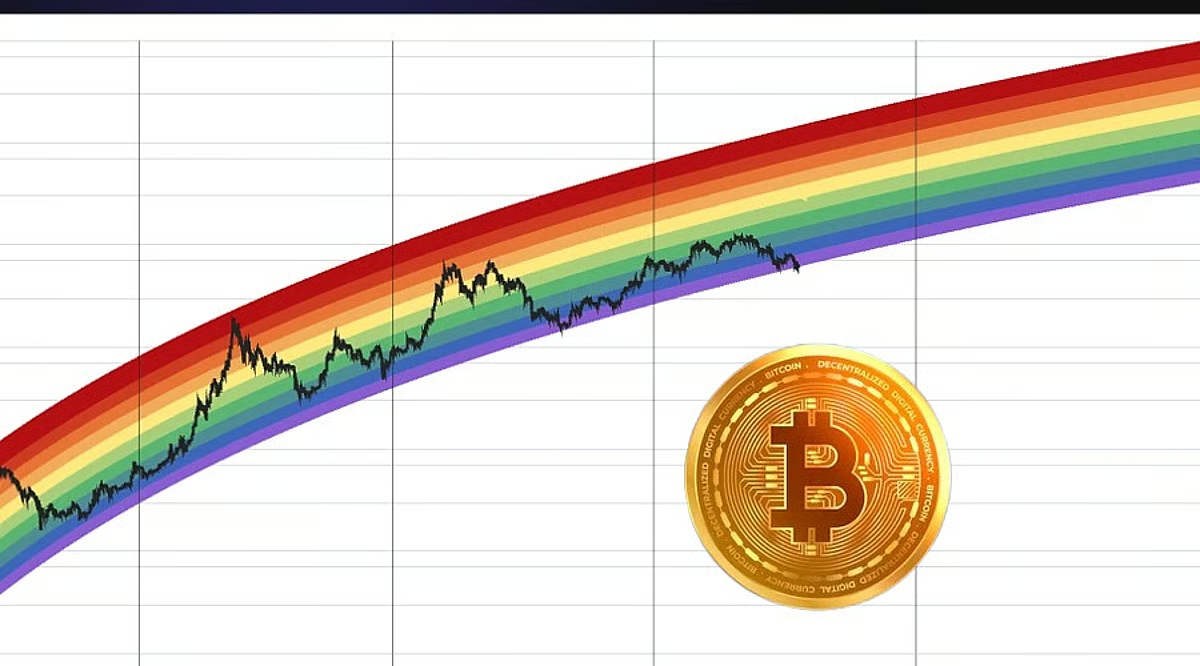
The Bitcoin Rainbow Chart is a logarithmic valuation tool that uses colored bands to show where BTC has historically traded within its long-term price trend. Lower bands suggest relatively depressed valuations, while higher bands reflect more speculative conditions.
2. Can the Bitcoin Rainbow Chart predict Bitcoin’s price?
No. BlockchainCenter itself states that the chart was not designed as a serious forecasting model. It is better used for historical context than as a standalone buy or sell signal.
3. What does the Bitcoin Rainbow Chart show in 2026?
Bitcoin has recovered strongly from its 2026 low near USD 57,776 and returned above USD 80,000. The move suggests improving momentum, but macroeconomic and technical risks remain important.
4. What are the key Bitcoin price levels to watch?
Support is seen around USD 71,781, with another important level near USD 75,674. Resistance sits near USD 82,793, and a breakout could bring USD 90,000 back into focus.
5. What factors matter more than the Rainbow Chart?
ETF flows, Federal Reserve policy, Treasury yields, dollar strength, liquidity and technical market structure can all influence Bitcoin more directly. Investors should use the Rainbow Chart alongside these factors rather than in isolation.