
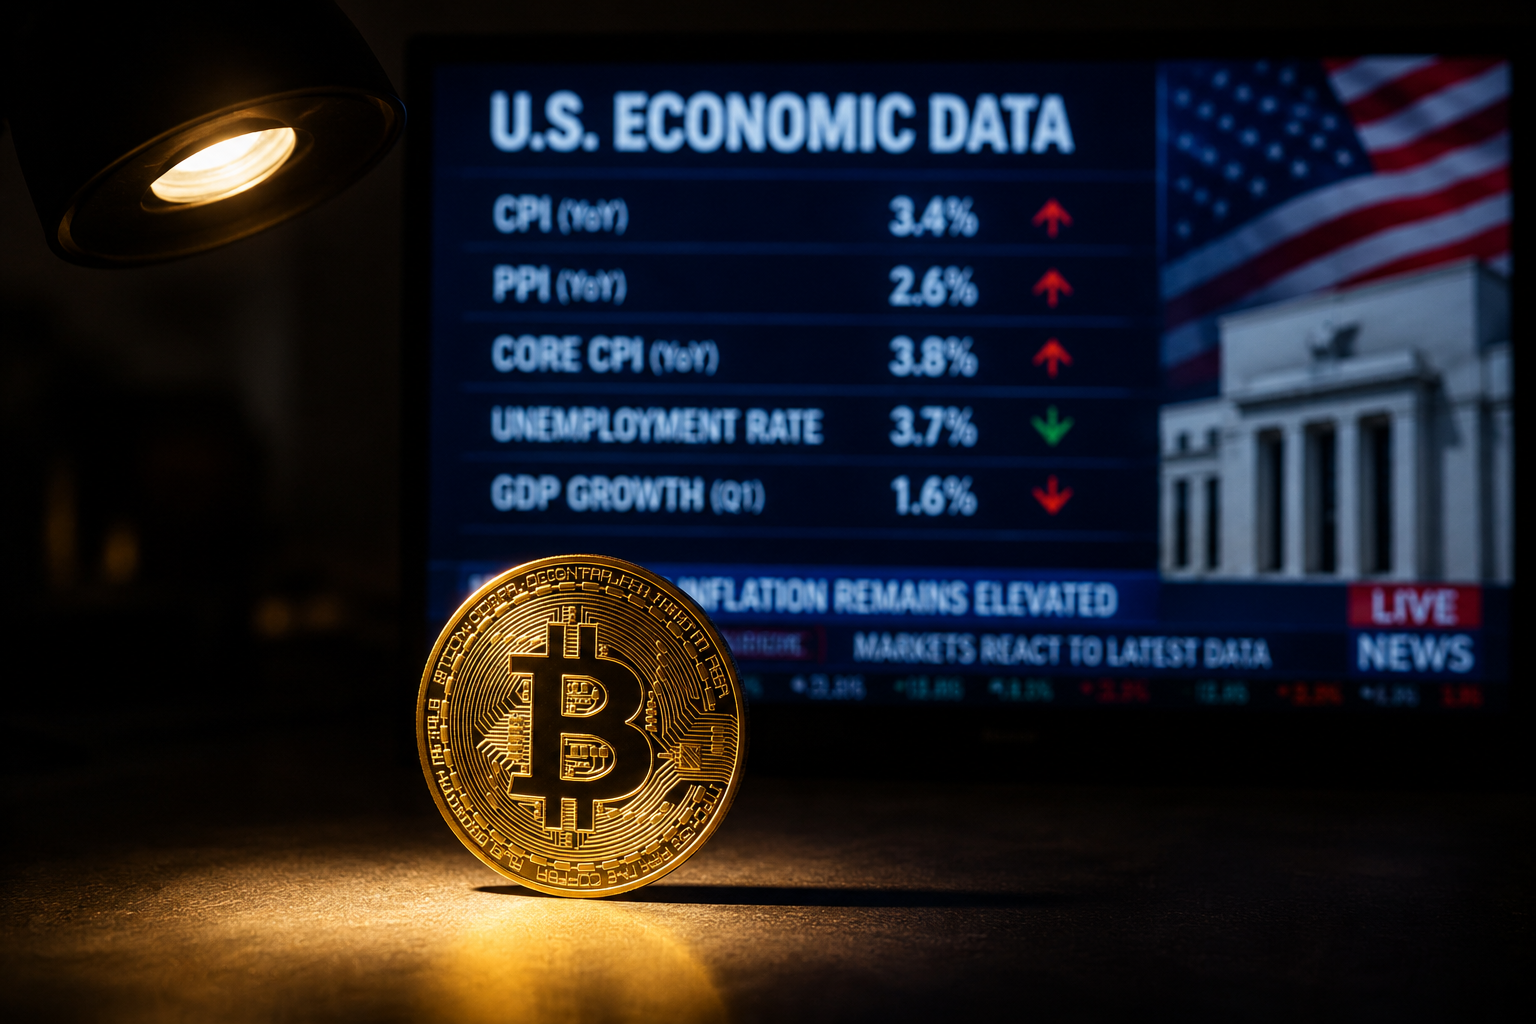
Bitcoin has remained above $62,000 ahead of key US inflation reports this week, with traders watching whether upcoming data can determine if the recent rebound from the $60,000 area has room to continue.
According to Trading Economics forecasts, the Consumer Price Index report scheduled for June 10 is expected to show headline inflation rising 0.5% month over month, slightly below April’s 0.6% increase.
Economists surveyed by Trading Economics expect annual CPI to accelerate to 4.2% from 3.8%, while annual core inflation is projected to reach 2.9%.
Attention will quickly turn to producer prices a day later.
Trading Economics data shows economists expect monthly headline Producer Price Index inflation to rise 0.6%, down from 1.4% previously, while annual producer inflation could climb to 6.4% from 6.0%.
Around current levels, Bitcoin is struggling to attract strong directional flows as investors wait for fresh inflation signals.
Market participants are also digesting the stronger-than-expected US labor market report released last week, which showed 172,000 nonfarm payroll additions compared with expectations of 85,000.
The data pushed the US 10-year Treasury yield to around 4.57% and strengthened concerns that interest rates could stay elevated for longer.
Fresh projections from BNP Paribas have added to those concerns.
The French bank now expects the Federal Reserve to begin a series of three rate hikes from December 2026, reversing the three rate cuts delivered in 2025.
BNP Paribas cited persistent inflation risks, a resilient labor market, and economic pressures linked in part to the ongoing US-Iran conflict.
Geopolitical developments have also remained in focus.
Recent missile exchanges between Israel and Iran contributed to higher oil prices, which several market participants view as a factor that could complicate the inflation outlook ahead of this week’s data releases.
At the time of writing, Bitcoin was trading near $62,782 after recovering from a recent slide below $60,000.
The daily chart shows Bitcoin rebounding from support close to the lower Bollinger Band near $58,251.

BTC/USD 1-day price chart. Source: TradingView.
However, the price was trading below the Bollinger Band basis, or 20-day simple moving average, located around $70,279.
Until buyers reclaim that level, the chart continues to show overhead resistance above current prices.
Volatility has remained relatively contained despite the recent selloff. The 14-day Average True Range stands near 2,383, well below the spikes seen during earlier periods of heavy market stress.
Such readings suggest traders are waiting for a catalyst rather than aggressively positioning in either direction.
Data from CoinGlass provides another clue about where traders are concentrating risk.
The latest 24-hour Bitcoin liquidation heatmap shows one of the largest liquidity clusters sitting around the $62,200 to $62,400 range.

Bitcoin 24-hour liquidation heatmap. Source: Coinglass.
Bitcoin recently swept through that area before stabilising, indicating that a notable amount of leveraged positioning may already have been cleared.
Above the spot price, additional liquidation pockets can be seen between roughly $64,000 and $65,000, extending toward the $66,000 region.
If inflation data comes in softer than expected, those levels could become short-term targets as traders move toward overhead liquidity.
Some analysts have identified the $71,000 to $72,500 area as a potential resistance zone should bullish momentum strengthen later in the month.
On the downside, a hotter inflation reading could bring attention back to the $62,200 area before traders reassess the larger $60,000 support region.
The daily chart continues to show that zone as one of Bitcoin’s most important technical levels.
Institutional activity has offered some support during the recent period of uncertainty.
Between June 1 and June 7, Strategy purchased 1,550 BTC for $101.3 million, increasing its holdings to 845,256 BTC.
The company also lifted its dollar reserves to $1 billion after concerns emerged following its sale of 32 BTC the previous week, its first reported Bitcoin disposal since December 2022.
While macroeconomic data remains the immediate focus, Strategy’s latest accumulation has helped reinforce the view among some investors that demand from long-term corporate holders remains present even as traders await direction from inflation and interest-rate expectations.