Bitcoin (BTC) remains central to Strategy’s treasury plan as Chairman Michael Saylor stated the company will continue buying the asset despite more than $5 billion in unrealized losses. Bitcoin is trading near $69,126, while the firm’s stock gained nearly 9% in after-hours trading on Friday.
Saylor Hints at New Bitcoin Buy Amid $5.1B Unrealized Gap
Saylor teased the latest purchase in his usual Sunday X post, where he linked to the company’s Bitcoin portfolio tracker with text saying “99>98.” The message indicated further building of company reserves.
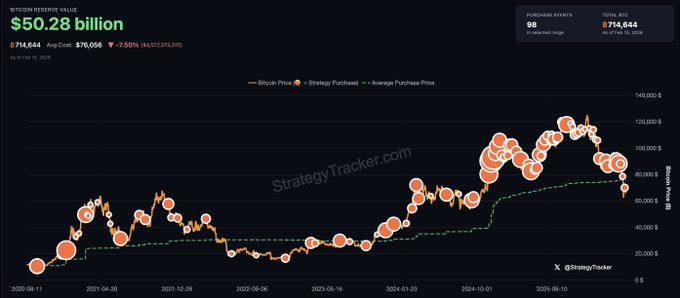
As CoinGape reported, the Strategy purchased 1,142 BTC for $90 million, paying an average of $78,815 per coin, taking its total holdings up to 714,644 BTC. The stash is worth roughly $49.36 billion at market value.
But the net total position is still around $5.1 billion below the cumulative purchase cost. However, the company added it has no intention of selling Bitcoin despite unrealized loss and expects to keep buying BTC every quarter indefinitely
Market analysts are tracking technical levels as Bitcoin holds support and momentum over the weekend. In an X post, analyst Ted pinpointed $72,000 as a major resistance. A continued move above that level could pave the way for a move toward $76,000 to $80,000.
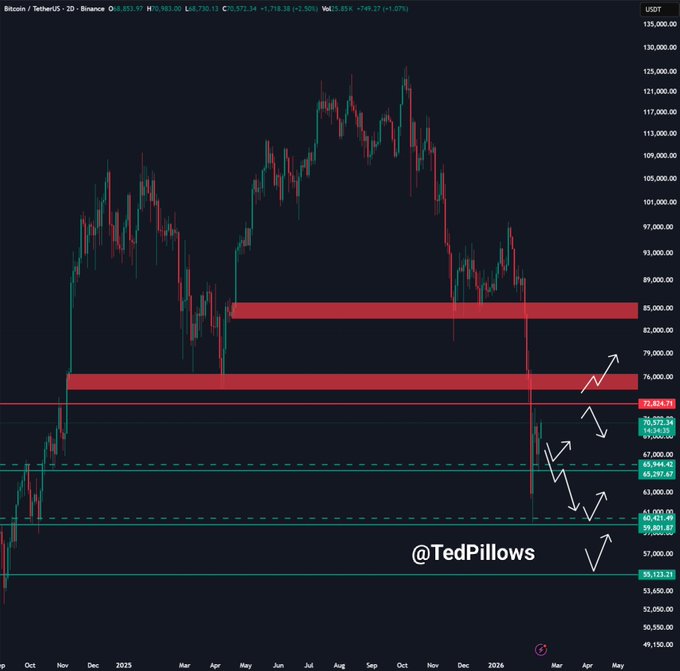
He also noted that $68,800 was a key support area. That level includes a CME gap that may receive attention next week. Liquidation figures show significant exposure in derivatives markets.
If BTC surges 10%, about $4.34 billion in short positions would be liquidated. By comparison, longs that would be liquidated by a 10% sell-off total about $2.35 billion.
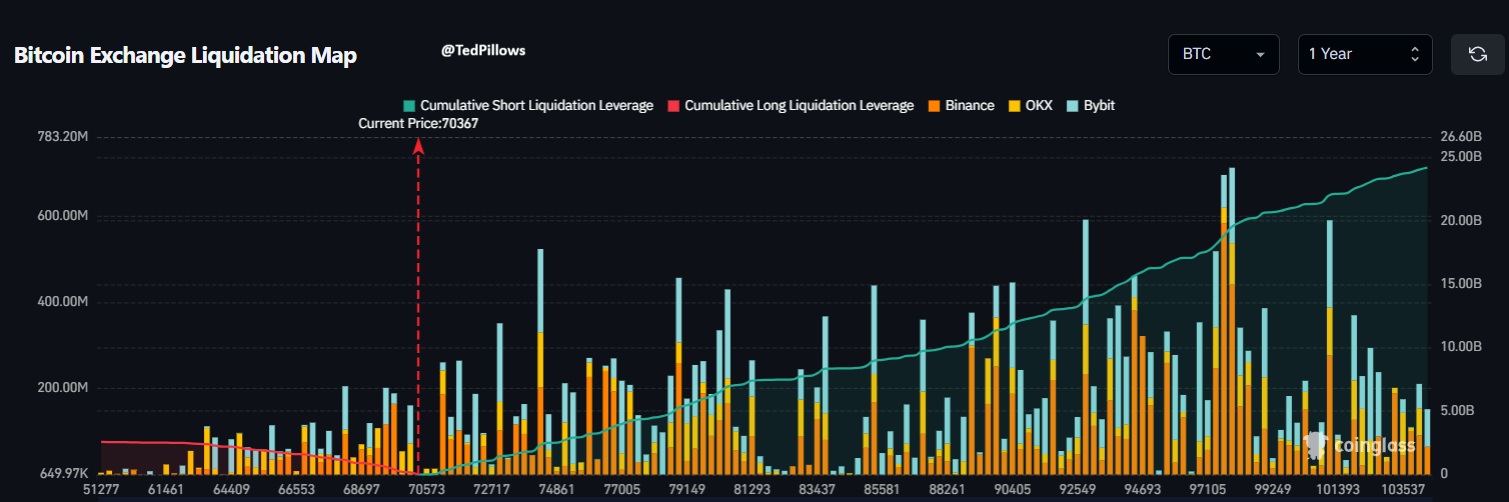
According to analyst, in the near term, positioning indicates upside pressure. The potential liquidation imbalance suggests that the influence of upward price movement is stronger.
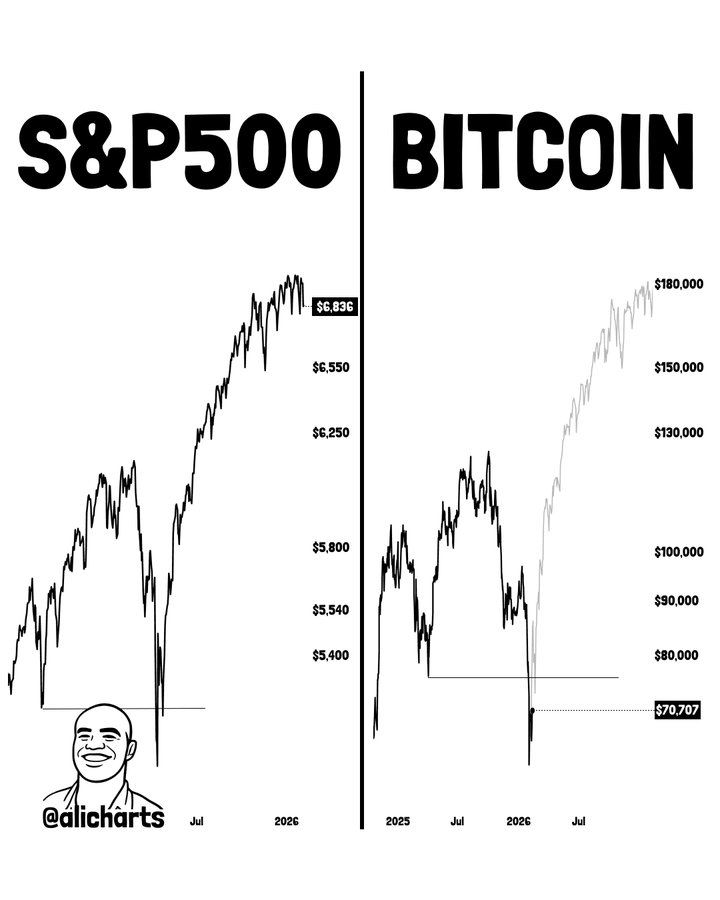
Another analyst, Ali, observed on Sunday that BTC seems like it is tracking the S&P 500’s trajectory as of late. He pointed out similarities in the overall pattern. Regaining $75,000 as support would greatly enhance the likelihood of the pattern playing out, according to the analyst.
How BTC Mirrors S&P 500 as $75K and $55K Define Risk
In an X post, analyst Ali observed on Sunday that BTC seems like it is tracking the S&P 500’s trajectory as of late. He pointed out similarities in the overall pattern. Regaining $75,000 as support would greatly enhance the likelihood of the pattern playing out, according to the analyst.
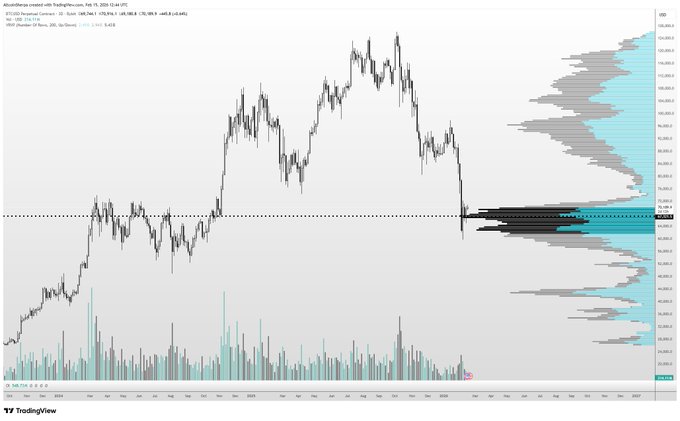
Analyst Altcoin Sherpa focussed on higher time frame structure. There remains a strong accumulation area between $60,000 to $70,000, he said. He’s not anticipating unusual volatility unless price rises well outside of that band, or falls to the downside. The broad structure is still defined by the range.
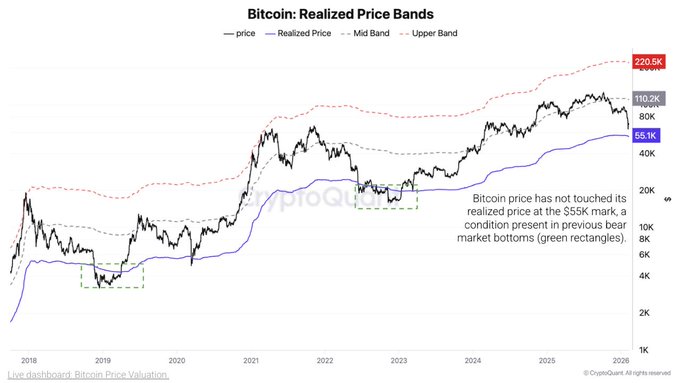
CryptoQuant focused on long-term bearish scenarios in regards to downside. The company declared that the realized Bitcoin price is about $55,000. It defined this level as the final bear market base based on historical cycles.
In past cycles, Bitcoin had dropped to 24% to 30% below its realized price. That pattern would suggest an eventual move to $39,000 if the same behavior plays out. The data evidences the structure of previous markets.