


Crypto Journalist
Anas Hassan
Crypto Journalist

Share


Bitcoin is approaching a historically important support zone near $62,000, as a long-tracked reserve-cost indicator tied to Binance signals that BTC could see more pain ahead.
The $62k reserve cost level has not been tested since the approval of U.S. spot Bitcoin ETFs in January 2024, raising fresh questions over whether the current drawdown marks a deeper bear phase rather than a routine correction.
The warning comes as multiple technical and on-chain indicators turn bearish simultaneously, even as parts of the market remain positioned for a renewed bull cycle in 2026.
Binance Reserve Cost Shifts the Post-ETF Floor
The Binance Reserve RP, which tracks the average acquisition cost of Bitcoin reserves on the exchange, has historically acted as a dividing line between bull and bear markets.
According to data shared by crypto analyst Burak Kesmeci, that level now sits at $62,000, a sharp rise from pre-ETF norms.
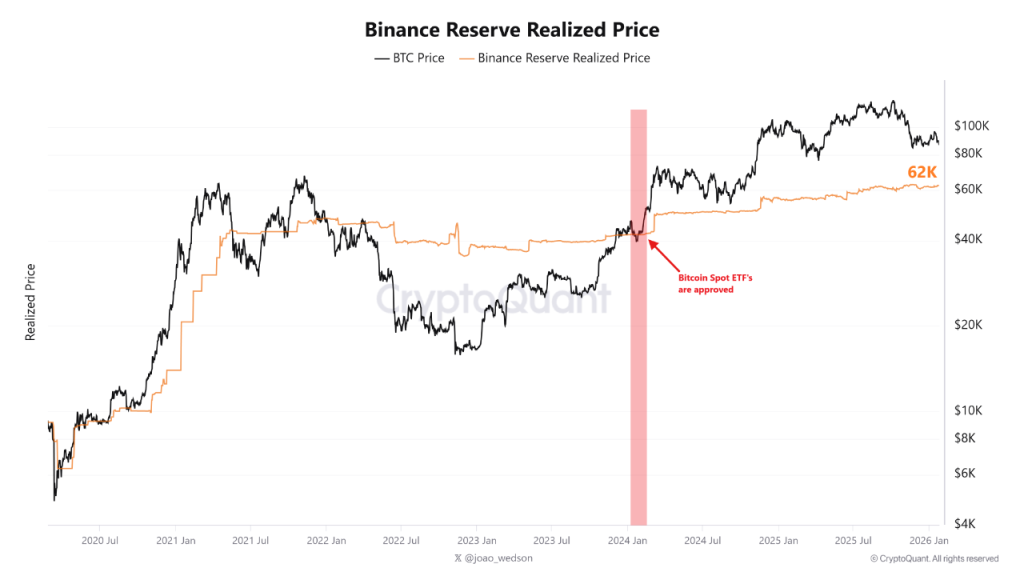
Before spot ETFs were approved, the indicator hovered around $42,000, reflecting a different market structure dominated by retail and offshore flows.
Since January 2024, institutional participation has altered price behavior, lifting the reserve cost and redefining what constitutes downside support.
“Bitcoin has never tested this level since Spot ETF approval,” Kesmeci said, noting that the price spent the entire bull run well above the $62,000 zone.
In his view, price action this year will determine whether $62,000 holds as a structural floor or breaks.
On-Chain Metrics Point to Early Bear Structure
Beyond exchange-based indicators, on-chain data is also flashing caution.
Bitcoin’s Supply in Loss has begun trending higher again, a shift that has historically marked the early stages of bear markets.
In past cycles in 2014, 2018, and 2022, the metric turned upward before prices reached their eventual lows.
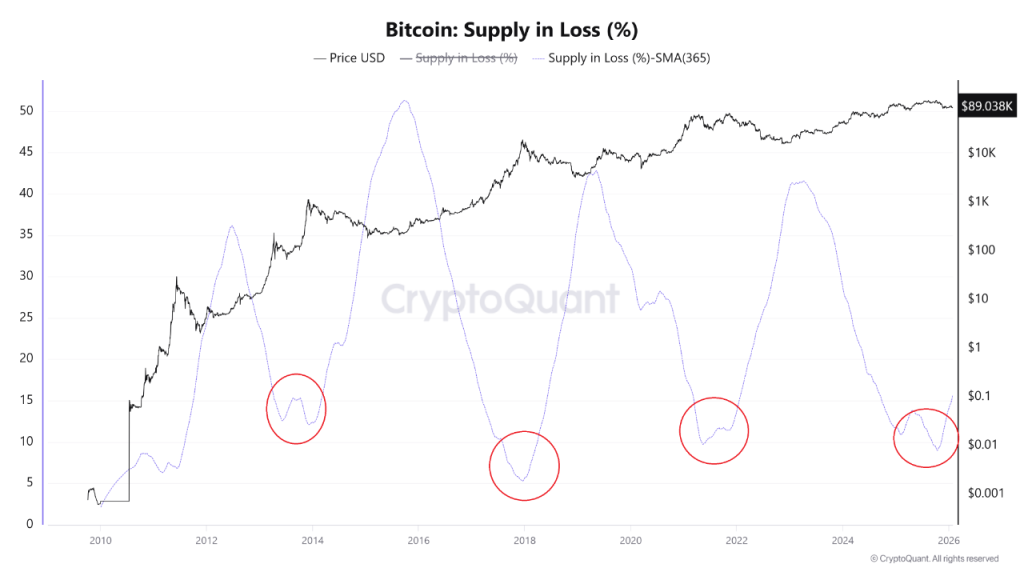
During those periods, losses gradually spread from short-term holders to longer-term participants as prices continued to weaken.
At present, Supply in Loss remains well below levels seen during full capitulation phases.
CryptoQuant’s head of research, Julio Moreno, has pointed to a similar clustering of bearish signals that emerged in early November and have yet to reverse.
He argues that the market may still be in the process of locating a durable bottom.
How Low Could Bitcoin Go?
Using Bitcoin’s realized price, which reflects the average cost basis of current holders, Moreno estimates a potential bear market low below the $62,000 reserve cost.
His projected range sits between $56,000 and $60,000 over the next year.
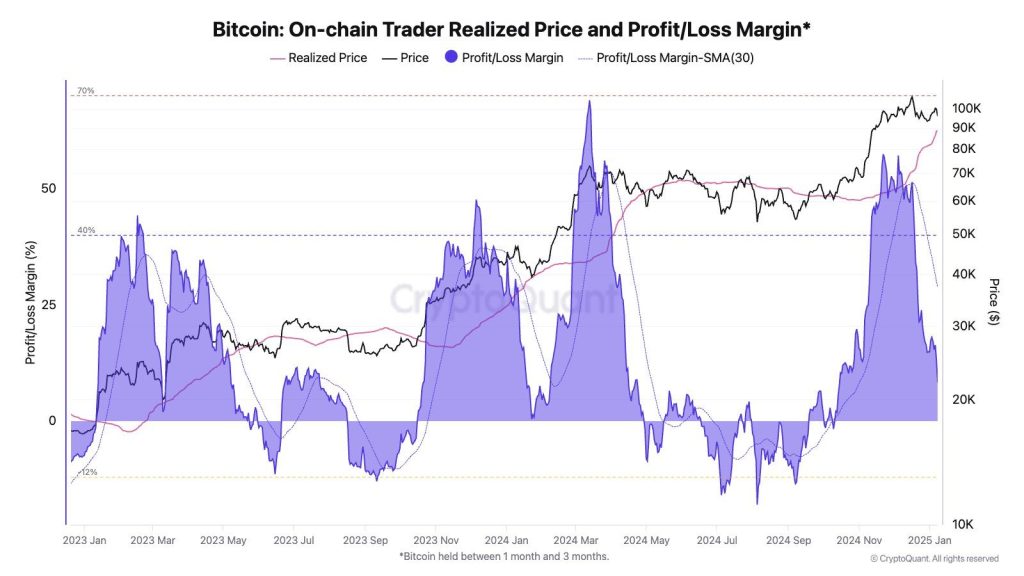
Historically, prolonged downturns have seen Bitcoin drift back toward realized price after overshooting during bull markets.
A move into that zone would imply a drawdown of roughly 55% from Bitcoin’s all-time high above $125,000.
While substantial, Moreno views such a decline as relatively modest compared with prior bear markets.
Previous cycles often produced losses of 70% to 80%, frequently amplified by cascading failures across the crypto sector.
Bitcoin Technicals Clash With Bullish Narratives
Technical indicators are also adding pressure to the bearish case.
A crossover of the 21-week and 50-week exponential moving averages, often referred to as the Bull Market EMA crossover, has recently appeared.
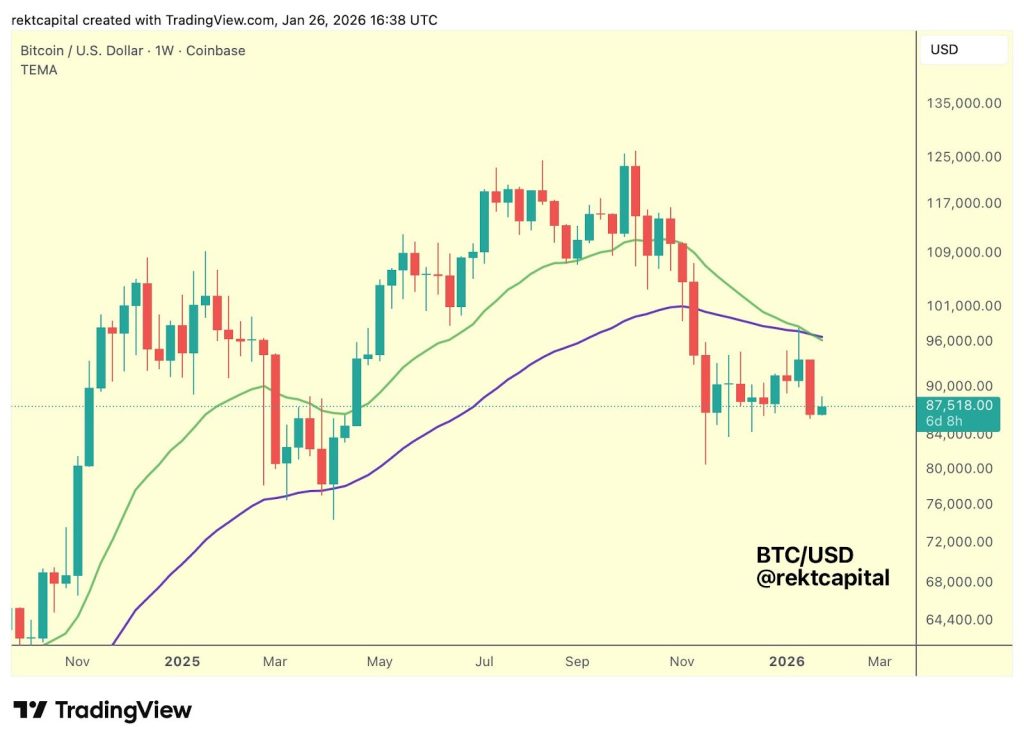
Historically, similar crossovers preceded deeper bear phases in Q4 2014, late Q3 2018, and early Q2 2022.
If the current Bitcoin phase is indeed a bear market, it would challenge expectations that 2026 will deliver another strong growth phase for Bitcoin.
Binance founder Changpeng Zhao has promoted the idea of a Bitcoin “supercycle,” while Grayscale researchers have questioned the relevance of the traditional four-year cycle.
Bernstein has also maintained a $150,000 target for 2026, describing the current environment as an “elongated bull market.”
Whether those forecasts hold may depend on Bitcoin reclaiming its 50-week moving average, currently near $100,988.
Until then, analysts say the market remains focused on downside risk management.
With more than $4.5 billion in realized losses recorded since BTC fell below $90,000, the next support test could define the cycle’s true low.