- Liquidation spikes align with sharp price reversals, revealing liquidity hunts rather than genuine trend strength
- Rising Open Interest during choppy price action indicates dangerous leverage accumulation across markets
- Rapid funding rate fluctuations between positive and negative territory expose unstable trader sentiment
- Bollinger Bands show mean reversion patterns driven by leverage resets instead of sustained spot flows
The current behavior of the Bitcoin market reflects leverage-driven dynamics rather than organic spot demand, according to recent technical analysis.
The 1-hour chart setup reveals price movements shaped primarily by liquidation events across derivatives markets. Sharp wicks and rapid reversals continue to dominate trading patterns as overleveraged positions get flushed out.
This environment creates conditions where liquidity-driven trades become the primary driver of short-term direction, rather than genuine buyer or seller conviction.
Derivatives Metrics Paint a Volatile Picture
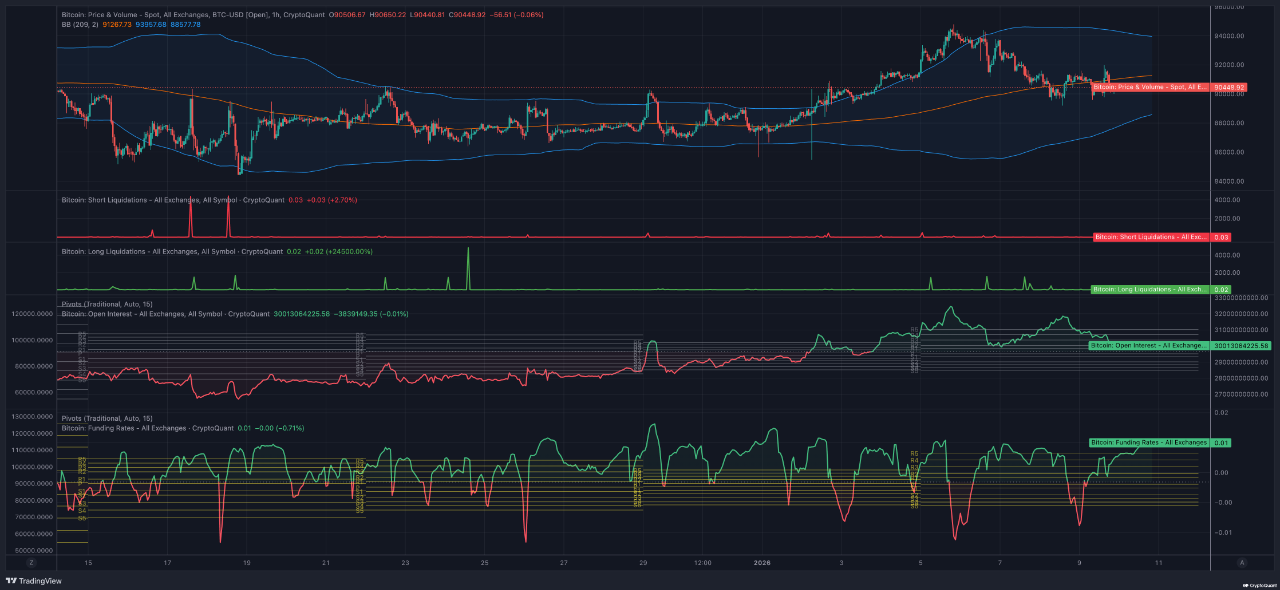
Liquidation spikes on both long and short positions align directly with sudden price reversals and extended wicks. These patterns typically emerge during liquidity hunts where compressed price action forces out overleveraged traders.
The moves do not indicate underlying trend strength but instead reveal stress building within derivatives markets. Traders caught on the wrong side face forced exits during these volatile periods.
Open interest continues rising during impulsive moves and stays elevated through subsequent pullbacks. This combination of high open interest with choppy price behavior points to leverage accumulation across the market.
Source: CryptoQuant
The buildup creates conditions ripe for sudden squeezes that can trigger moves in either direction. Market participants face increased risk when leverage concentrations reach extreme levels during range-bound trading.
Funding rates demonstrate rapid fluctuations between positive and negative territory throughout recent sessions.
These swings reflect how quickly trader sentiment shifts following major liquidation events. Recovery from deeply negative funding can provide support for short-term bounces.
However, persistently unstable funding often serves as a precursor to additional volatility rather than sustainable trend development.
Technical Indicators Confirm Leverage-Driven Dynamics
Bollinger Bands analysis shows price frequently mean-reverting toward the mid-band during recent trading sessions. Band expansion episodes coincide directly with liquidation-heavy price moves rather than sustained directional momentum.
The volatility appears manufactured through leverage resets instead of genuine spot market buying or selling pressure. This pattern reinforces the view that derivatives positioning drives current price discovery mechanisms.
Liquidation spikes warrant treatment as volatility warnings rather than direct entry signals for position building. Elevated open interest combined with stretched funding metrics increases squeeze risk across the board.
High-leverage strategies become especially dangerous when these conditions persist. Market participants should exercise caution when these warning signs appear simultaneously.
Healthier market conditions typically emerge when open interest begins cooling and funding stabilizes. These developments prove more constructive than scenarios where open interest rises during rebounds.
The current setup reflects a market where liquidity hunts drive short-term direction through leverage positioning. These metrics remain valuable for identifying risk zones but require confirmation from spot flows and higher-timeframe structure analysis.