

This week: seasonality, defensive stocks, valuations and allocations, equity supply trends, commodities in focus, resources stocks, inflation risk.
Learnings and conclusions from this week’s charts:
-
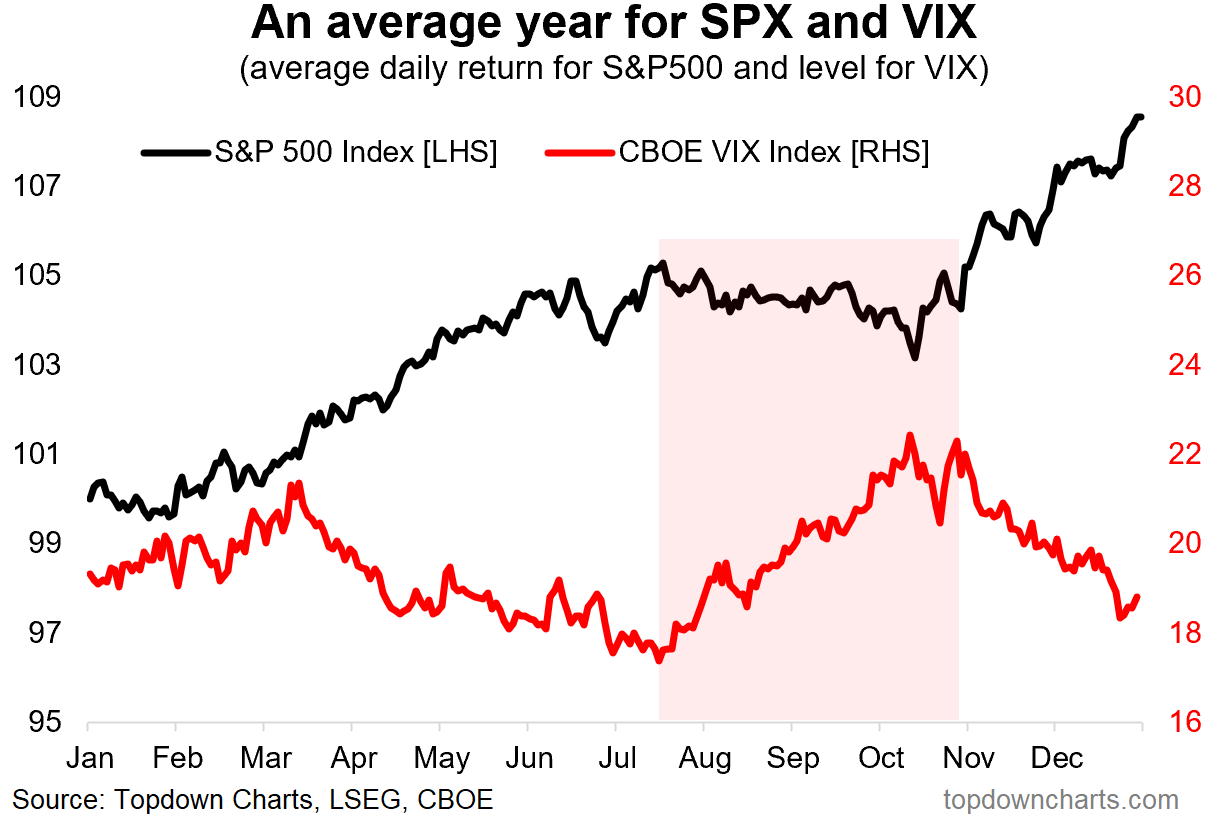
Seasonality is soft into Oct (before YER season begins).
-
Defensive’s deep discount = danger.
-
Valuations & Allocations are at generational highs.
-
Negative net issuance has been a tailwind for stocks.
-
Commodities look bullish, and investors are underexposed.
Overall, as a point of self-reflection, I hate to sound permabearish, but when many of the most interesting charts are sounding warning signs, you can’t just ignore it or get fixated on perception management (you gotta just keep calm and keep charting on). That said, this week’s set of charts definitely has a bearish/warning hue… but actually also some interesting bullish stuff in the latter part that not many people are talking about (charts 8-10 +the bonus chart/theme section).
1. Seasonal Pointy End
We’re heading into the pointy end of what has historically been a softer part of the year for stocks. But that also means the YER [Year-End-Rally] is drawing closer. With momentum so strong, it’s entirely possible we cruise onwards and upwards into the new year.
Source: Chart of the Week – Changing Seasons
2. Defensives — Deep Value
Zooming out from seasonal stats into some bigger picture stuff, one of the most remarkable charts on my radar at the moment is the relative value indicator for defensive stocks (, , ). The RV indicator is getting very close to the deep discount it reached around the peak of the dot-com bubble.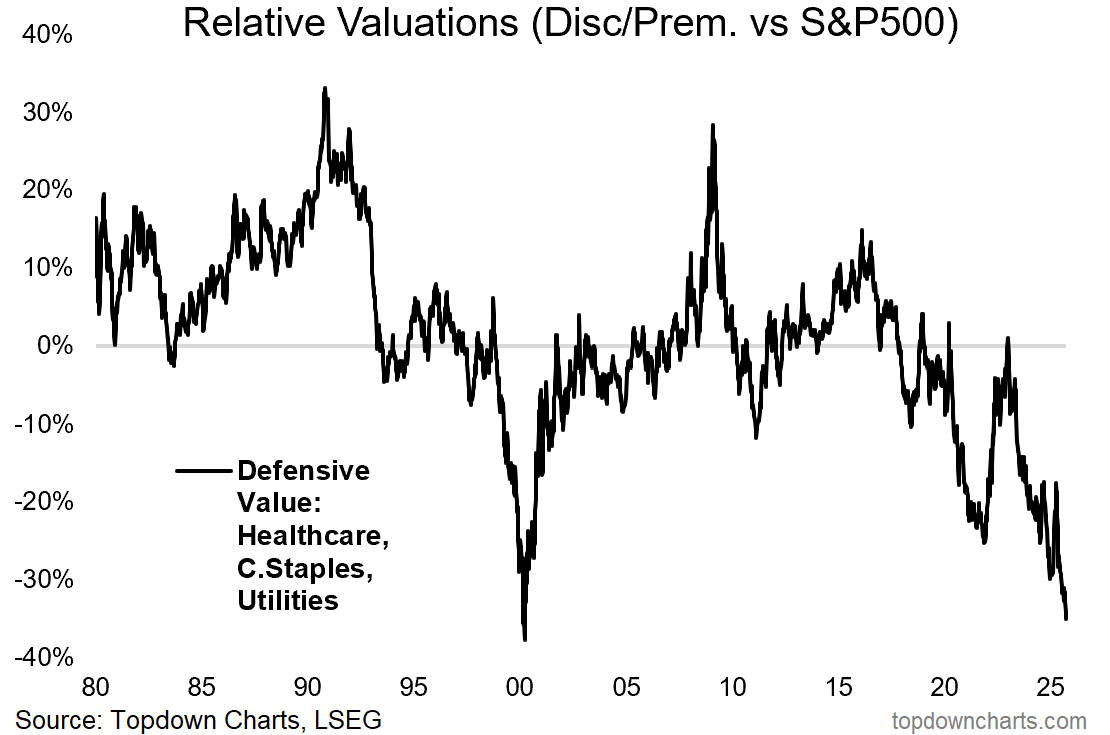
Source: 10 Charts to Watch in 2025 [Q3 Update]
3. The Bad Thing About Defensives Looking Good
To spell out why this matters, here’s the relative performance of defensives overlayed against the S&P 500. As you can see, there is information in the extremes of the black line — it reaches extreme highs around market bottoms (where investors pile into defensives), and extreme lows around market peaks (where investors shun defensives and crowd into the hottest stocks). In that respect, this chart is at warning levels.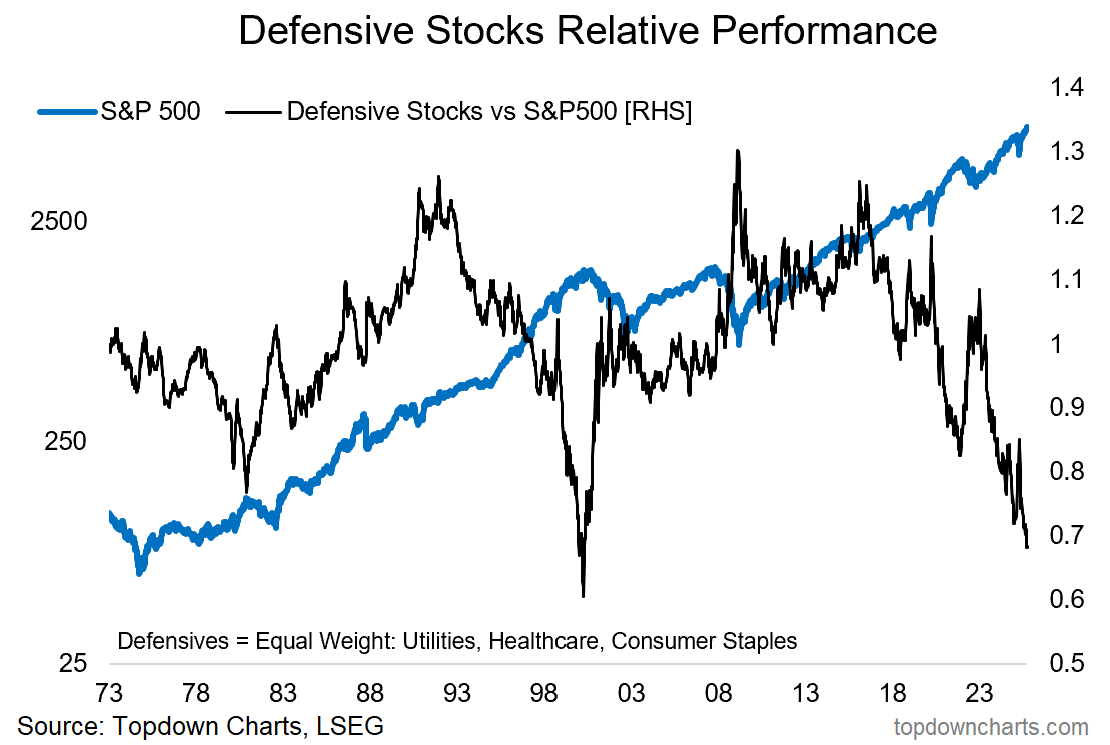
Source: Topdown Charts
4. Valuations = Confidence Indicator
On a similar theme, as you probably already knew; valuations and investor allocations to equities are at historically extreme levels (which has likewise been a warning sign in the past). But this goes to highlight an interesting perspective: valuations are basically confidence indicators… and sometimes the crowd is right to be confident (rationally exuberant).
But sometimes that turns to overconfidence when future expectations outpace what is realistically possible in the short-run, and complacent when the things that originally inspired confidence begin to no longer apply.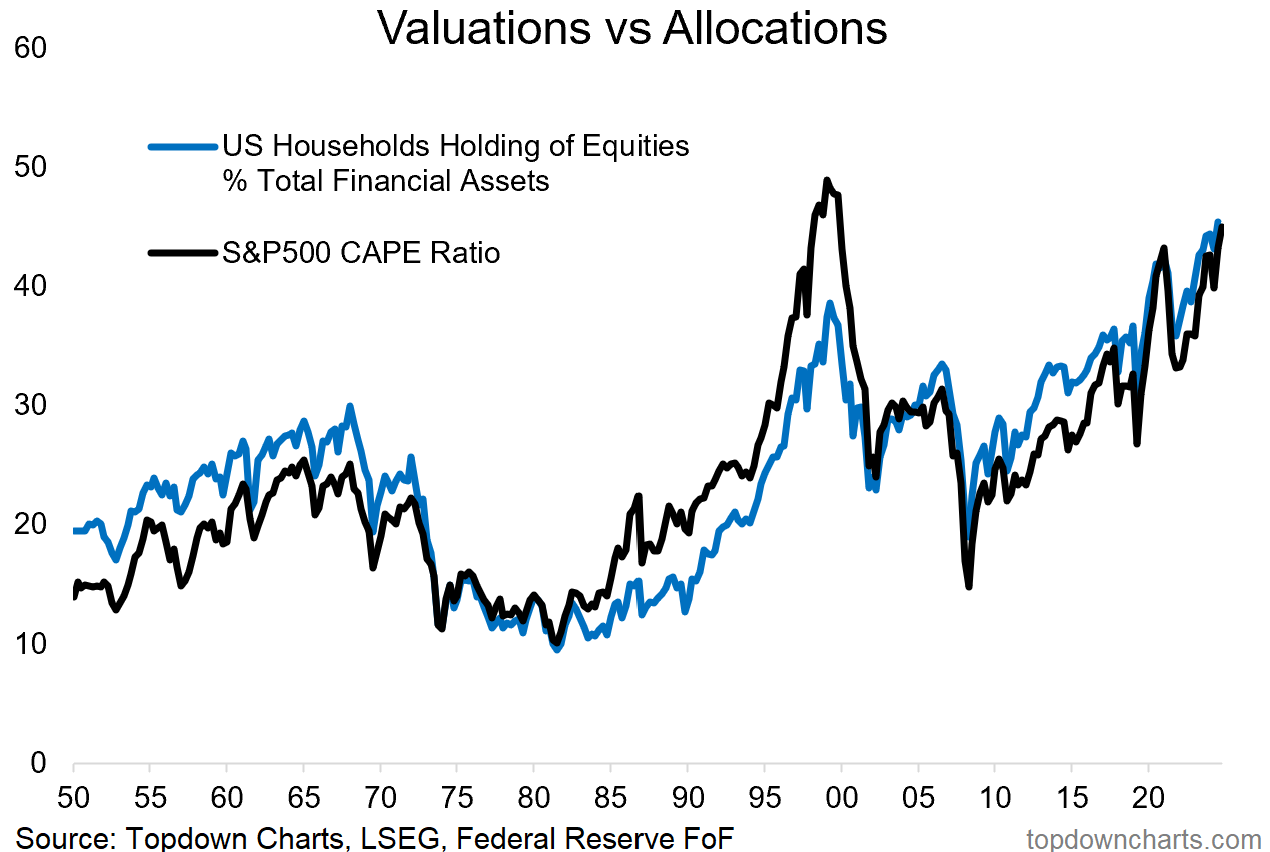
Source: ChartStorm Perspectives Pack (updated chart)
5. Foreign Investor Confidence in US Equities
Another sign of the times and a historical tailwind behind equities has been increasing foreigner allocations to US equities — which just reached a new all-time high.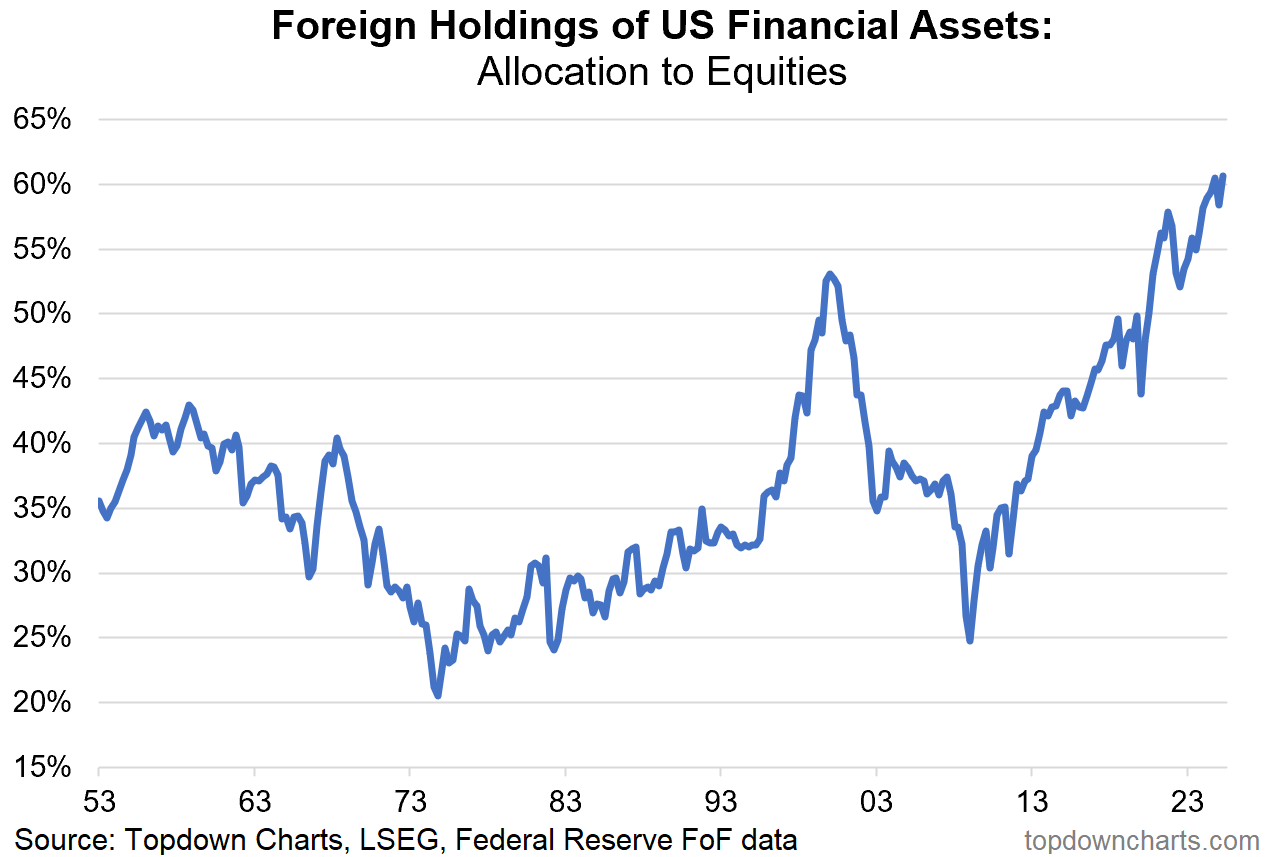
Source: Topdown Charts Professional
6. The Reason Stocks Keep Going Up
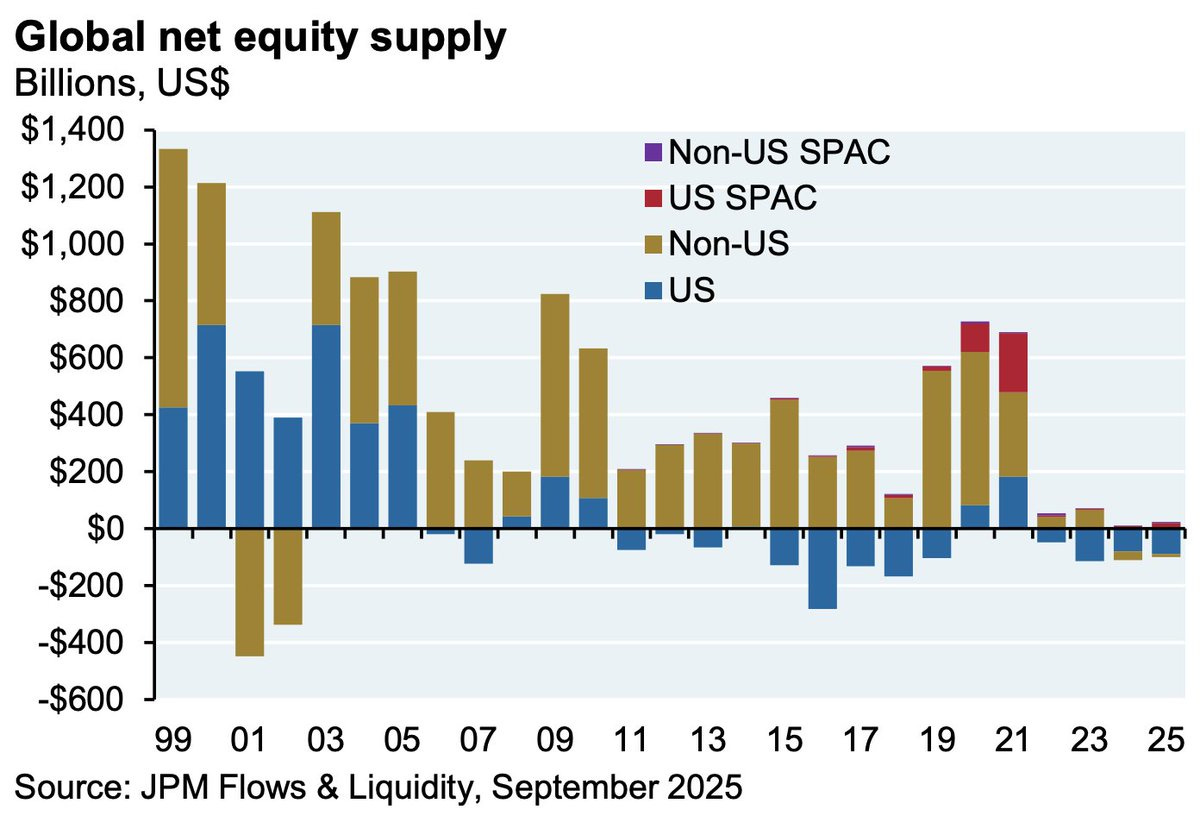
With global and domestic investors steadily raising allocations to equities, it’s only logical stocks go higher as JPM analysis shows global net equity supply has been zero-to-negative in recent years… It’s ECON 101 — hold supply steady and raise demand = price goes up (ceteris paribus).
Source: @dailychartbook
7. Net Equity Supply
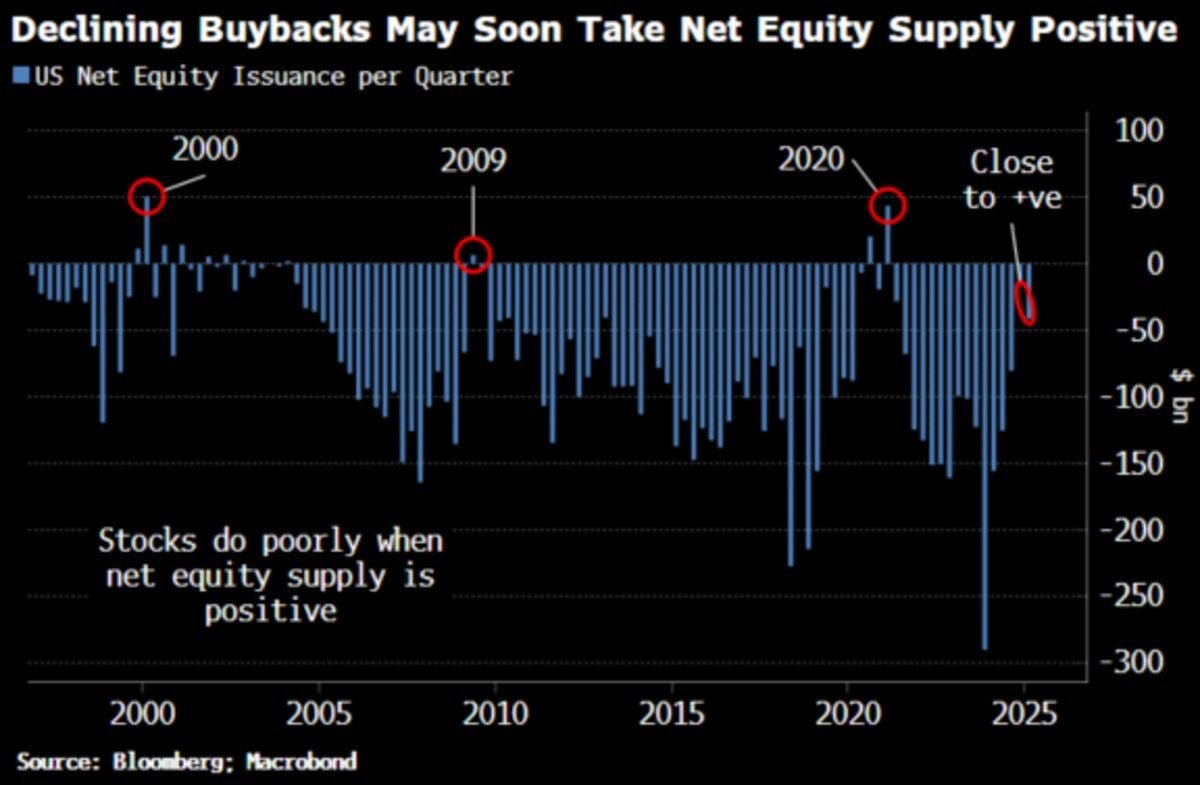
But similar analysis from Bloomberg shows this trend starting to unwind as IPOs ramp-up and buybacks ease-off. Which would be an inconvenient development given where some of those long-term cycle indicators we just looked at are tracking.
Source: @MauiBoyMacro
8. Commodities in Focus
Switching gears, it’s time to look at something bullish. As I noted the other day, a key theme in 2026 is likely to be — and specifically, in my view: a new bull market in commodities.